Market Heist in Progress! US30/DJI Long Trade – Ride or Escape?🔥 "The US30/DJI Heist: Bullish Loot & Escape Before the Trap!" 🔥
🌟 Hi! Hola! Ola! Bonjour! Hallo! Marhaba! 🌟
Dear Money Makers & Market Robbers, 🤑💰💸✈️
Based on the 🔥Thief Trading Style🔥 (technical + fundamental analysis), here’s our master plan to heist the US30/DJI (Dow Jones Industrial Average). Follow the strategy on the chart—long entry is the play! Aim to escape near the high-risk RED Zone (overbought, consolidation, potential reversal). The bears are lurking, so take profits and treat yourself—you’ve earned it! 💪🏆🎉
🚀Entry (The Vault is Open!)
"Swipe the bullish loot at any price!"
For precision, place buy limit orders within 15-30min timeframe (recent swing lows/highs).
Set alerts! Don’t miss the heist.
🛑 Stop Loss (Safety Net)
Thief-style SL at nearest swing low (3H timeframe) → 41,400 (adjust based on risk/lot size).
🏴☠️ Target 🎯: 44,200.00
Bullish momentum is fueling this heist—ride the wave but exit before the trap!
📰 Fundamental Backing (Why This Heist Works)
Macroeconomic trends, COT data, geopolitics, and sentiment align for bullish moves.
Full analysis? Check our bio0 linkk! 👉🔗🌎
⚠️ Trading Alerts (News & Risk Mgmt)
Avoid new trades during high-impact news (volatility = danger).
Use trailing stops to lock profits and dodge sudden reversals.
💥 Boost This Heist!
Hit 👍 (Boost Button) to strengthen our robbery squad!
More heists = More profits—stay tuned for the next steal! 🚀🤑
See you soon, fellow thieves! 🤝🎉
USAIND trade ideas

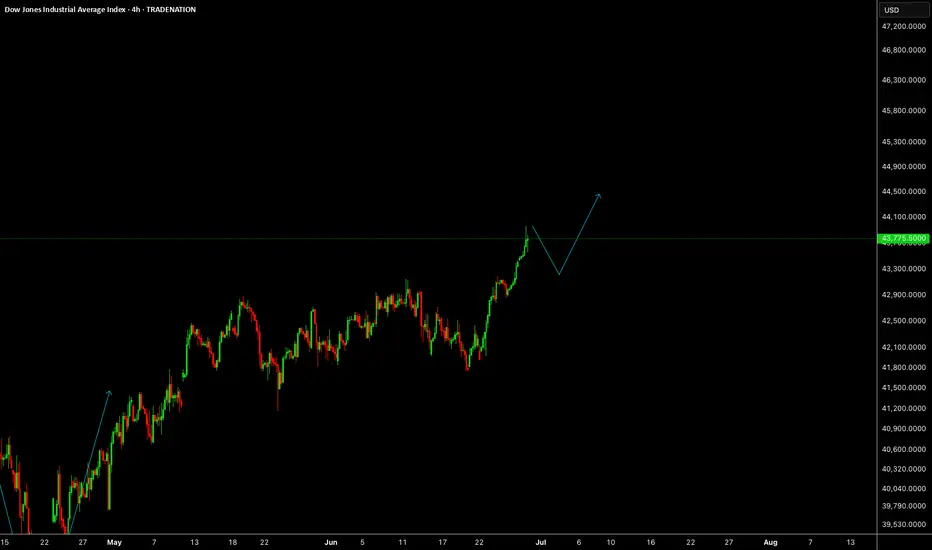
US30We expected US30 to give us a reaction from above 43.5K, market has given us more than 2K points move, now we will wait for the correction before any more buys.
Disclosure: We are part of Trade Nation's Influencer program and receive a monthly fee for using their TradingView charts in our analysis.
Look into it{
"alerts": [
{
"name": "US30 Bull Break",
"condition": {
"symbol": "US30",
"operator": "crossing",
"value": 43950
},
"message": "📈 US30 Breakout Alert: Price crossed above 43,950. Watch for BUY setup targeting 44,100.",
"actions":
},
{
"name": "US30 Bear Rejection",
"condition": {
"symbol": "US30",
"operator": "crossing_down",
"value": 43800
},
"message": "📉 US30 Bearish Rejection: Price fell below 43,800. Watch for SELL setup toward 43,400 OB.",
"actions":
}
]
}
US30 Is on the move up as sellers get low buyers are winning the move pushing the price all the way up as there is a lot of pressure for the price to go all thr way higher to create a w shape as seen in the chart watch out for more buys than sells on this pair goodday

US30Persistent inflation and expectations about Federal Reserve interest rate policy continue to influence investor sentiment.
Sector Performance: The rally has been broad-based, with increased activity in industrials and technology components.

US30 looking for the short on Bearish PAI believe we can expect a pull back down to JuBias: Short-term Bearish (Contingent Setup)
Context: Price is currently trading just below a high-probability supply zone between 44,048 – 44,277. This area aligns with prior highs and liquidity, making it a prime zone to look for a short-term rejection if strong bearish price action (PA) appears on the 4H or Daily timeframes.
We are currently seeing strong bullish momentum on the Weekly, Daily, and H4 candles. Any short positions from this zone must be reactive — not anticipatory. A clear bearish signal (e.g., engulfing, structure break, supply confirmation) is required to consider entry.
Key Zone:
Seek bearish PA between 44,048 – 44,277
Contingency: If price breaks and closes above 44,250 (2024 highs), expect continuation toward 45,000
Short Targets if Rejection Occurs:
Target 1: 43,350
Target 2: 42,500
Extended Target: 41,734 (June Low)
Post-Rejection Bullish Scenario:
If we do get a rejection and targets are met, we will then look for bullish PA in the demand zones (42,500 or 41,700) to consider long setups back toward the 2024 highs and potentially beyond.
Breakout Scenario:
If price breaks and closes above the 44,277 zone early this week, we anticipate the next leg to 45,000 before any meaningful reversal.
At this stage, it’s a waiting game — let price action lead. We don’t predict, we react.ne lows before an

Weekly Forex Outlook Sun.June.29.2025 - Fri.July.4.2025Like and Comments would be appreciated :D Not Financial Advice, Just my outlook/opinion

US30 DETAIL ANALYSIS
1. Fundamental Analysis
The US30, tracking 30 of the largest publicly traded companies in the U.S., currently reflects a mixed but cautiously optimistic macroeconomic backdrop.
Economic Growth Outlook
The U.S. economy contracted by 0.5% annualized in Q1 2025, revised down from initial estimates. The contraction was largely driven by a surge in imports before new tariffs took effect, which distorted net exports. As a result, the Federal Reserve revised its 2025 GDP growth forecast to approximately 1.4%—a downgrade from the previous 1.7% projection. Private-sector forecasts, including those from Deloitte and S&P Global, echo this view, suggesting a growth range between 1.1% and 1.5% for the year.
Inflation & Federal Reserve Policy
Core PCE inflation—the Fed’s preferred metric—rose to 2.7% year-over-year in May, above the central bank's 2% target. Similarly, core CPI held at 2.8%. While inflation is cooling compared to previous cycles, it remains sticky. Consequently, the Fed has signaled no immediate plans to cut rates, with the earliest possibility being in September. Inflation expectations for year-end 2025 have been revised up to around 3%, in part due to geopolitical shocks and new tariffs.
Labor Market & Consumption Trends
The unemployment rate remains stable near 4.2%, reflecting labor market resilience. However, real disposable income and consumer spending both declined in May, down 0.3% and 0.7%, respectively. The drop indicates potential weakening in consumer demand and future GDP prints. Confidence indices also showed a dip, although a decline in inflation expectations could moderate the downside pressure.
Tariff Effects and Global Risk
Average U.S. tariff levels are at historic highs, ranging between 15–19%, weighing on import costs and corporate margins. The ongoing trade frictions with China, coupled with Middle East tensions (particularly between Israel and Iran), add geopolitical volatility and inflationary risks. Leading institutions warn of stagflation—a toxic mix of slow growth and persistent inflation—pressuring equity valuations.
2. Commitment of Traders (COT) Report Evaluation
The latest COT data reflects a nuanced view of institutional behavior in equity index futures:
Asset Managers have increased net long exposure to US indices, including the Dow, suggesting underlying bullish conviction from long-term holders.
Leveraged Funds (Hedge Funds) have shown mixed sentiment—reducing short positions, but not aggressively adding longs—indicating a cautious optimism.
Retail Traders are predominantly short , which often signals further upside potential due to their tendency to be positioned against the dominant trend.
This asymmetric positioning—combined with macro and structural tailwinds—strengthens the smart money bias toward continuation of the bullish trend, especially as the Dow approaches key technical levels.
3. Technical & SMC-Based Analysis
The daily US30 chart reflects a clear bullish structure, rooted in classic Smart Money Concepts:
Market Structure
A Valid Break of Structure (BOS) confirms upside intent, following a successful sweep of internal liquidity.
The sequence of Higher Highs (HH) and Higher Lows (HL) remains intact.
Internal Liquidity has been swept, with price now targeting external liquidity near the All-Time High (ATH) zone.
Key Technical Levels
Buying Area 1: Around 43,150 – labeled as the H4 inducement zone. A retest here with bullish price action (engulfing or FVG fill) may trigger continuation long entries.
Buying Area 2: Between 42,450–42,650 – a deeper demand zone where price previously showed strong displacement. A high-probability re-entry zone upon confirmation.
Short-Term Sell Area: Around 44,800 – this zone aligns with potential distribution. Short positions should only be considered here upon confirmation of bearish BOS.
ATH & BSL: The final liquidity target in the current structure, marking the range highs.
Liquidity Pools
Sell-Side Liquidity (SSL): Around 41,800, and a Strong Low exists near 40,900 – both are key areas to be respected in the bullish thesis.
Price is currently aiming toward external BSL above ATH, which is likely to be swept before any significant correction.
4. Strategic Outlook & Trade Plan
✅ Bullish Continuation Scenario
Buy Entry #1: 43,150 zone – confirmation through bullish PA on retest.
Buy Entry #2: 42,450–42,650 – deeper re-entry upon mitigation of FVG or OB.
Take Profit Targets:
TP1: 44,800 (potential distribution zone),
TP2: 45,200 (external BSL at ATH).
Stop Loss: Below 42,200 (under Demand Area 2 or SSL).
⚠️ Bearish Contingency (Only if BOS to Downside)
Monitor for failed structure or strong rejection at 44,800–45,200.
BOS below 43,000 could shift structure and signal a move toward the 42,200 zone.
Break of Strong Low (~40,900) invalidates bullish structure.
Conclusion
The current market environment supports a measured bullish bias in the US30, driven by:
Resilient labor and inflation expectations moderating;
Institutional accumulation per COT data;
A technically clean smart money bullish structure;
Potential for liquidity sweep above ATH before any significant distribution.
That said, macro risks such as tariffs, global geopolitical tensions, and sticky inflation remain key wildcards that could introduce volatility.
NOTE: ONLY FOR EDUCATIONAL PURPOSE NOT A FINANCIAL ADVICE

Dow Jones Wave Analysis – 27 June 2025
- Dow Jones broke pivotal resistance level 43000.00
- Likely to rise to resistance level 44500.00
Dow Jones index recently broke above the pivotal resistance level 43000.00 (which has been reversing the price from the end of March, as can be seen from the daily Dow Jones chart below).
The breakout of the resistance level 43000.00 accelerated the active impulse wave 3 of the intermediate impulse wave (C) from the end of May.
Dow Jones index can be expected to rise to the next resistance level 44500.00, which is the target price for the completion of the active impulse wave (C).
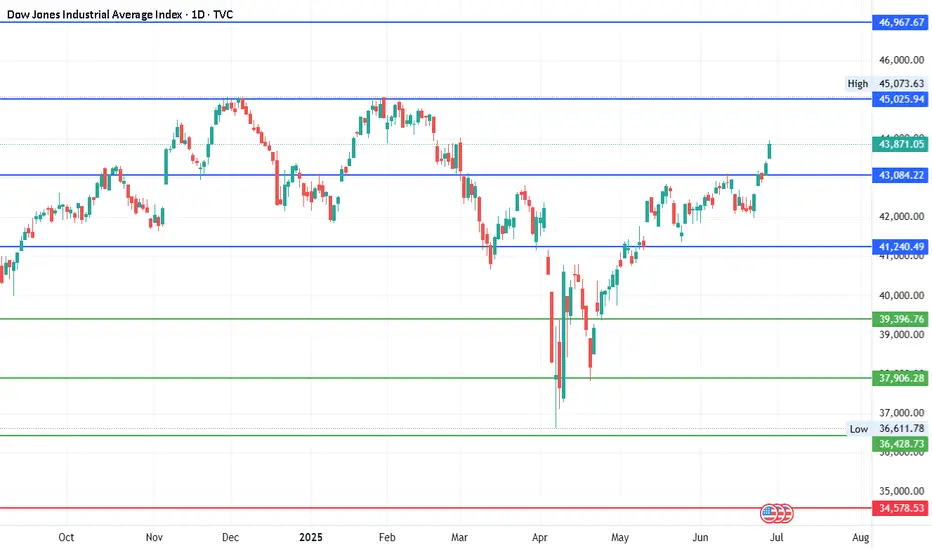
#DJI - 5000 Pts already moved out of 8000 points..Date: 27-06-2025
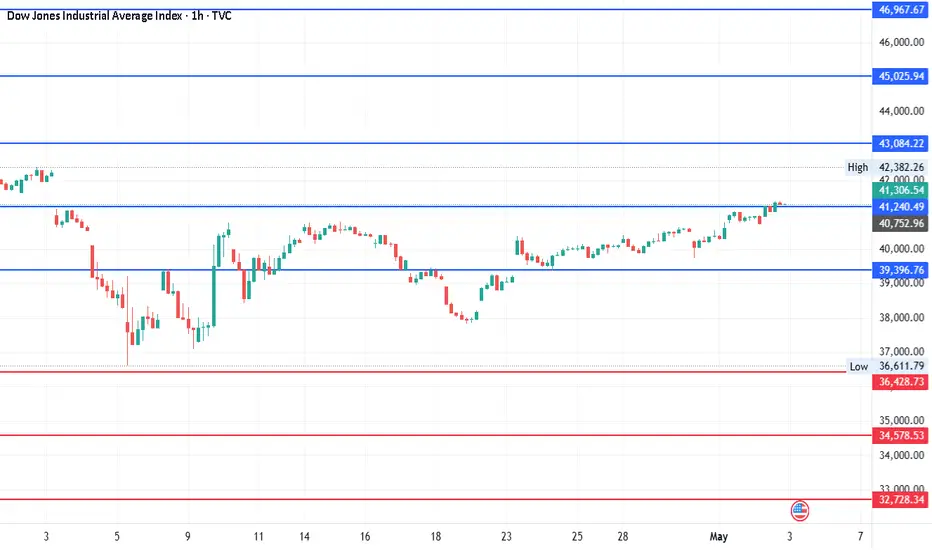
#DJI - 5000 Pts already moved out of 8000 points as posted on 22nd April. Another 3000 points to cover. we have different pivot for the next level up and it will be shared soon.
Old levels are as follows.
#DJI Upside Targets: 41240.49, 43084.22, 45025.94 and 46967.67
#DJI Downside Targets: 34578.53, 32728.34, 30786.61 and 28844.88
Current price is around 43,870 at the time of this post.
DJI - 2000 pts already moved out of 8000 pts since last posted?It has already moved around 2000 points since last posted on 22nd April. Expecting around 8000 points moved as per mentioned earlier and the levels are still the same. Introduced additional levels for the better understanding. So, another 6000 points move pending before any reasonable correction? let's see.
Upside: 41240.49, 43084.22, 45025.94 and 46967.67
Downside: 34578.53, 32728.34, 30786.61 and 28844.88
US30 (Dow Jones) Analysis – June 2025 Outlook📊 US30 (Dow Jones) Analysis – June 2025 Outlook
🔍 1. Fundamental Analysis
The US30 (Dow Jones Industrial Average) is currently navigating a complex environment shaped by macroeconomic shifts and geopolitical tensions. Below is an in-depth review of current factors influencing its price action:
🏦 Monetary Policy & Economic Indicators
Federal Reserve Stance:
After a series of rate hikes between 2022 and 2024, the Fed has adopted a more dovish tone in 2025.
Market consensus now expects the Fed to cut rates by Q3–Q4 2025 as inflation cools and growth moderates.
Inflation:
The May 2025 CPI came in lower than expected at 2.7% YoY, signaling disinflation.
Core CPI and PCE data also reflect a slowing pace of price increases, strengthening the case for easing.
Labor Market:
Non-farm payrolls have stabilized, but wage growth is slowing.
Unemployment remains low at 3.8%, but job creation is skewed toward lower-paying service sectors.
Growth Metrics:
ISM Manufacturing PMI remains below 50 (contraction), but Services PMI is resilient.
Consumer confidence dipped recently, reflecting uncertainty, yet consumer spending remains robust.
🌍 Geopolitical Climate
Iran–Israel Conflict Escalation (Mid 2025):
The recent Iran-Israel military clashes have rattled markets, briefly triggering risk-off flows.
The conflict has led to spikes in crude oil prices, pushing energy stocks higher but raising concerns about inflation re-acceleration.
US–China Relations:
Ongoing trade tensions over semiconductors and AI have led to sanctions on key Chinese tech firms.
Despite this, tech-heavy indices remain resilient due to domestic demand and AI sector optimism.
Global Monetary Policy Divergence:
While the Fed is dovish, the ECB has already started cutting rates, boosting global liquidity.
This divergence supports capital inflows into US equities, especially defensive and industrial sectors represented in the Dow.
📉 2. Technical Analysis (Smart Money Concepts)
The daily chart of US30, as annotated, reflects a clear transition from a bearish structure to a bullish regime, validated by Smart Money Concepts (SMC) methodology:
🔄 Market Structure Shift
Bearish Trend: Price was forming Lower Highs (LH) and Lower Lows (LL) into early 2025.
Change of Character (ChoCH): A significant bullish shift occurred with a closure above 42842, invalidating the prior LH and suggesting institutional buying.
Break of Structure (BOS): Followed by a clean higher high, reinforcing the bullish momentum.
🧱 Key SMC Levels & Zones
Buy Zone (Demand):
Between 41,600 and 41,800, this region aligns with:
A previous Higher Low (HL)
A visible Fair Value Gap (FVG)/Imbalance
Psychological support zone
Expected to be a strong institutional demand zone for a long setup.
IDM (Intermediate Demand Mitigation):
Minor liquidity grab possible before retest of buy zone.
An early sign of bullish intent may appear here.
Bearish Invalidation Level:
41,179 is the key structural level.
A daily closure below 41,179 would invalidate bullish bias and trigger a bearish BOS.
📈 Trend & Liquidity Outlook
Liquidity Pools:
Sell-side liquidity rests below recent HLs, particularly near IDM and the Buy Zone.
Buy-side liquidity above recent HH (~43,800) is the next target if price rebounds.
Trendline Support:
Ascending trendline from April continues to hold.
Acts as dynamic support intersecting the Buy Zone in late June.
Targets:
TP1: 43,000 (recent swing high)
TP2: 43,800–44,000 (liquidity magnet zone)
Final Supply Zone: 45,078 (historical resistance, visible on chart)
📌 Scenario Planning (SMC-Based)
Primary (Bullish) Scenario:
Price retraces into Buy Zone (41,600–41,800).
Forms bullish engulfing or displacement candle.
Entry long → Target 43,800+, SL below 41,179.
Alternate (Bearish) Scenario:
Price closes below 41,179 (breaks structure).
Bias flips to bearish.
Next support zone lies around 40,300–40,500.
NOTE: ONLY FOR EDUCATIONAL NOT A FINANCIAL ADVICE

US30 POTENTIAL SETUPUS30 Analysis
Fundamental Analysis:
The US30 (Dow Jones Industrial Average) continues to face turbulence as global and domestic factors interplay. Recently, several key macroeconomic and geopolitical developments have influenced sentiment:
FOMC Outlook: The Federal Reserve’s decision to pause interest rate hikes amidst easing inflation suggests a more dovish stance. However, labor market resilience and retail sales indicate lingering strength in consumer demand.
Geopolitical Risk – Iran-Israel Conflict: The renewed tensions in the Middle East—especially between Iran and Israel—have heightened risk sentiment. Oil prices are sensitive to the conflict, indirectly pressuring inflation and causing volatility in equity markets.
US Economic Indicators:
CPI (Consumer Price Index): Showed moderate deceleration, aligning with the Fed’s inflation target.
Unemployment Rate: Remains low, strengthening confidence in the soft-landing narrative.
Manufacturing and PMI Data: Indicate a slowdown, showing a mild contraction phase in industrial activity.
These mixed signals are feeding into a cautious yet opportunity-laden market environment for indices like US30.
Technical Analysis (SMC - Smart Money Concepts):
Current Market Structure:
The price recently broke structure (BOS) to the upside after a series of higher lows and equal highs.
It’s now in a pullback phase, showing a classic inducement pattern where early liquidity is grabbed below recent equal lows.
Key Zones:
Buy Zone: Marked between 41,460 to 41,357 (H1 FVG) , which lies just above the protected low at 41,150.
A sweep of equal lows followed by confirmation (e.g., BOS on lower timeframe like H4) would validate a long entry.
Risk Management:
Stop-loss: Below 41,150, signaling bearish intent if broken (CHOCH – Change of Character).
Take-profit Target: Upwards toward 42,911, aligning with previous highs and order block inefficiencies.
Bearish Scenario: A daily closure below 41,150 would invalidate the bullish setup and suggest a deeper retracement toward the next key support near 40,636.
NOTE: Not a financial advice only for educational purpose

#US30 Buy 43575.4#US30 Buy 43575.4
SL 43515.4
TP 43595.4
TP 43675.4
TP 43815.4
Trade at your own risk
Protect your capital
The Wizard 🧙♂️ SWFX

US30: Local Bearish Bias! Short!
My dear friends,
Today we will analyse GOLD together☺️
The price is near a wide key level
and the pair is approaching a significant decision level of 43,673.57 Therefore, a strong bearish reaction here could determine the next move down.We will watch for a confirmation candle, and then target the next key level of 43,576.88..Recommend Stop-loss is beyond the current level.
❤️Sending you lots of Love and Hugs❤️

DOW JONES Will Keep Growing! Buy!
Hello,Traders!
US30 is trading in an
Uptrend and the index broke
The key horizontal level
Around 43,200 and the
Breakout is confirmed so
We are bullish biased
And we will be expecting a
Further bullish move up
Buy!
Comment and subscribe to help us grow!
Check out other forecasts below too!
Disclosure: I am part of Trade Nation's Influencer program and receive a monthly fee for using their TradingView charts in my analysis.

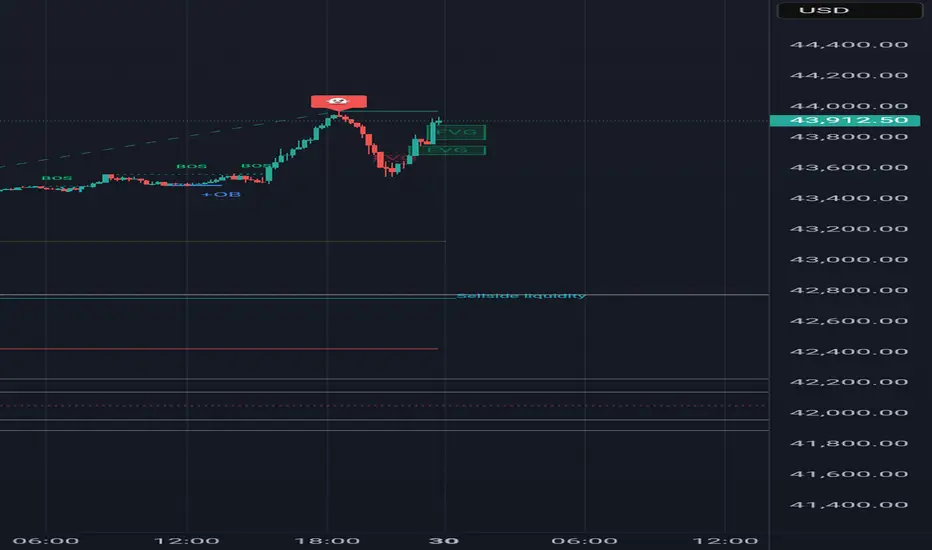
US 30 Potential longUS30 – Wyckoff Spring Setup for NY Session | Intraday Execution Play
Price rallied in the London session with rising volume and structure breaks —
Now we’re anticipating a classic Wyckoff spring scenario just ahead of NY open.
📍 Key Expectations:
Sweep of intraday support around 43,482
Strong buyer reaction (spring confirmation)
Expansion into the 43,600+ zone — possible 1.5R+ continuation
⚠️ Volume buildup + stop placement below prior structure make this zone ripe for a fakeout → reversal.
I’m watching for a quick flush below the line → wick rejection → engulfing confirmation to trigger longs.
This is a trap trade — smart money baits shorts, I’m betting they get squeezed.
🔫 Entry: On confirmation after spring
📉 Invalidation: Below the spring low
🎯 Target: 43,610 zone and trailing after break of 43,570
Let them walk into the trap. Then pull the trigger.

Dow Jones Retesting 43,020 | Bullish Bias Intact Above 42,810US30 OVERVIEW
Dow Jones Holds Bullish Momentum | Eyes on Retest and Continuation
US30 (Dow Jones) remains under bullish pressure, supported by recent macro developments and improving sentiment.
The price appears to be forming a retest toward 43,020, which could act as a springboard for further upside.
As long as the index trades above 42,810, the bullish trend remains intact, targeting 43,350, and potentially 43,765.
However, a confirmed break below 42,810 would shift the outlook to bearish in the short term.
Resistance Levels: 43,350 → 43,765
Support Levels: 43,020 → 42,810
Previous idea:

PCEs & attacks on PowellWe are carefully monitoring the PCEs today, to see, "wins" this small battle in the rate-lowering war. Let's dig in.
Let us know what you think in the comments below.
Thank you.
77.3% of retail investor accounts lose money when trading CFDs with this provider. You should consider whether you understand how CFDs work and whether you can afford to take the high risk of losing your money. Past performance is not necessarily indicative of future results. The value of investments may fall as well as rise and the investor may not get back the amount initially invested. This content is not intended for nor applicable to residents of the UK. Cryptocurrency CFDs and spread bets are restricted in the UK for all retail clients.

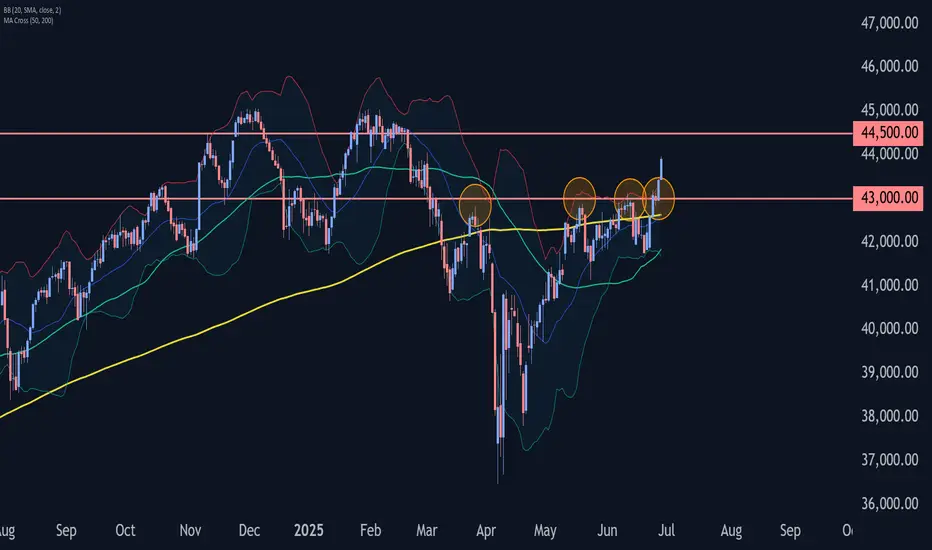
Dow Jones (US30) — Bullish Momentum, But a Retest AheadUS30 — Preparing for a Retest Before Higher Push
Subtitle: Technical Outlook — 27 June 2025
📈 Current Market Condition
The US30 index has shown strong bullish momentum, breaking above prior resistance around 43,000 and extending towards 43,500. Price is currently above both the 50 EMA (blue) and 200 EMA (red), reflecting a bullish structure. However, the Stochastic indicator signals overbought conditions, suggesting the index may be due for a pullback or consolidation before attempting to break higher into the 44,500–44,750 resistance zone.
🔑 Key Technical Highlights
Structure: Price broke above consolidation zone 42,750–43,000, retesting higher levels.
50 EMA (blue): Positioned near 42,750, acting as dynamic support.
200 EMA (red): Below at 42,200, major trend support.
Stochastic: Overbought — risk of a short-term correction or sideways move before continuation.
Resistance: Major resistance at 44,500–44,750.
Support: Immediate support at 43,000–43,250, deeper at 42,500.
📝 Trade Plan
Bullish Breakout (Long)
Trigger: Retest and hold of 43,000–43,250 zone with bullish confirmation (e.g. bullish engulfing, hammer).
Target: 44,500 / 44,75
Stop-loss: Below 42,900
Bearish Rejection (Short)
Trigger: Strong rejection from 44,500 with bearish reversal pattern.
Target: 43,250 / 42,750
Stop-loss: Above 44,700
Dip Buy
Trigger: Price tests 42,750 (50 EMA) and shows bullish reversal.
Target: 43,500 / 44,500
Stop-loss: Below 42,500
⚠️ Risk Management Note
US30 is trading in extended conditions, so chasing price here carries risk of getting caught in a pullback. Use staggered entries and adjust position size relative to volatility. Watch out for upcoming macroeconomic releases that could trigger sharp moves.
If you found this analysis valuable, kindly consider boosting and following for more updates.
Disclaimer: This content is intended for educational purposes only and does not constitute financial advice.

DOW JONES INDEX (US30): Consolidation is Over
Dow Jones Index completed a bullish accumulation on a daily.
The price violated a key horizontal resistance cluster and closed above that.
Next goal for bulls is 43790.
❤️Please, support my work with like, thank you!❤️
I am part of Trade Nation's Influencer program and receive a monthly fee for using their TradingView charts in my analysis.

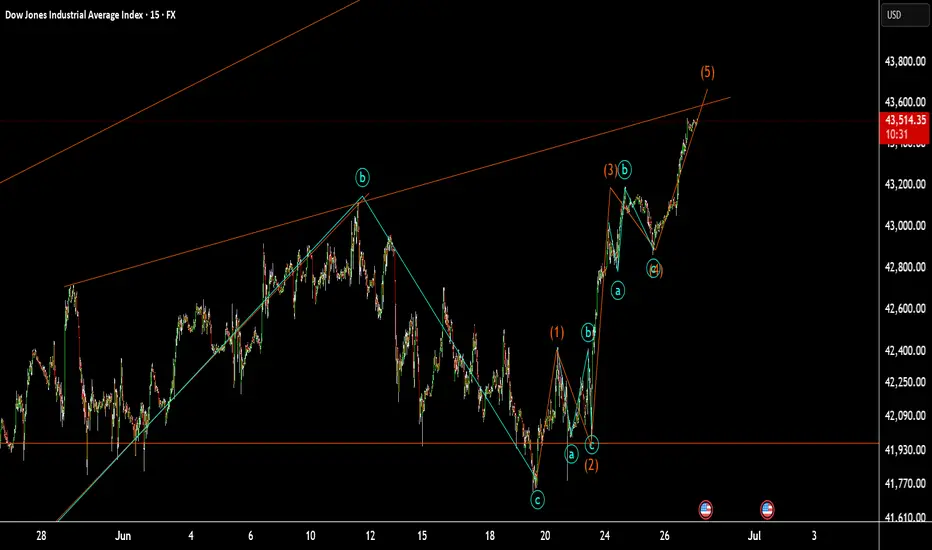
US30 at small resistanceUS30 at small resistance:
as I counter these wave we are in wave 5. it might be goes up to the maim trend Line in previous analysis.
US30 Testing Key Resistance ZonesUS30 has shown renewed bullish momentum with a strong breakout candle above the 42,800.00 resistance. After consolidating for several sessions, price surged upward, now hovering near the 43,800.00 zone—an important resistance level from prior highs.
Support at: 42,800.00 🔽 | 41,900.00 🔽
Resistance at: 43,800.00 🔼 | 44,362.79 🔼 | 45,011.92 🔼
🔎 Bias:
🔼 Bullish: A daily close above 43,800.00 opens the path to test 44,362.79 and potentially 45,011.92.
🔽 Bearish: Rejection from current level and a break below 42,800.00 may trigger a pullback toward 41,900.00.
📛 Disclaimer: This is not financial advice. Trade at your own risk.
