USARUS trade ideas

Russell 2000 Index, Weekly Daily Chart Analysis For April 27, 20Technical Analysis and Outlook
The small-cap Russell 2000 index gained 2.2% for the week. The index hit our uptrend movement projection to Inner Index Rally $1,365 and Key Res $1,350 , respectively, on April 29th. The short term downside support is tapped at Mean Sup $1,250 and prone to go down to Mean Sup $1,185 before thrusting the retest of the Key Res $1,360 .

RUT End Of Week EvaluationTrend Analysis:
The current trend is defined by the last price and it's relationship to specific moving averages.
Check the MA strategy for more specific suggestions.
Weekly: The relationship to the primary trend MA is bearish. The price in relationship to the other averages suggest hold current position but prepare to close, ensure stops are placed.
Daily: The relationship to the primary trend MA is bullish. The price in relationship to the other averages suggest hold current position but prepare to close, ensure stops are placed.
Price Action:
Weekly: The average price range currently is 100.242 points/ticks/pips. Prices are currently 1.219x the normal trading range. Prices are trading within the mean range for activity. This generally indicates a healthy trading range.
Prices are currently caught in consolidation between 966.215 and 1396.245.
While in consolidation the trade range may decrease to 61.8 points/ticks/pips.
Daily: The average price range currently is 39.50 points/ticks/pips. Prices are currently .62x the normal trading range. Prices are trading within the mean range for activity. This generally indicates a consolidation of strength/indecision in the market regarding direction.
Prices have broken through the low value of the consolidation range.
Standard Deviation
Weekly: Standard deviation suggests a range from 997.514 to 1468.593 for the following week.
Daily: Standard deviation suggests a range from 1190.16 to 1330.801 for the follow on trading day.
Calculated Price Strength:
The strength of the trend in conjunction with specific averages
Weekly: Trend strength suggests a trade range of 1198.53 to 1322.43 for the following week.
Daily: Trend strength suggests a trade range of 1236.07 to 1284.89 for the following day.
Price Projection:
The price action has generated a projection signal for the underlying.
Weekly: Price currently displays (if strength and attitude continue) a desire to move first toward 1179.23 before moving toward 1383.76
If strength and attitude continue, it could take between 2 - 4 trade periods (weeks) for the first projection and 3 - 6 to reach the second projection.
Daily: Price currently displays (if strength and attitude continue) a desire to move first toward 1236.27 before moving toward 1219.58
If strength and attitude continue, it could take between 1 - 2 trade periods (days) for the first projection and 1 - 2 to reach the second projection.
Indicators Summary.
A collection of technical indicators whose directional attitude has been summarized.
Weekly: Out of the cumulative indicators monitored, 27.27% are bullish, 45.45% are bearish, 27.27% are neutral
Daily: Out of the cumulative indicators monitored, 60.00% are bullish, 10.00% are bearish, 30.00% are neutral
The CCI indicator trading strategy suggest the following:
Weekly: Strongly bearish - No entries at this time. If in, consider covering..
Daily: Bullish - cover longs.
Confirmation Signal
6 indicators combined to confirm entry/exit.
Weekly Bearish - Close/Cover directional trades
Daily Bullish - Open directional trades

RUT Month End EvaluationTrend Analysis:
The current trend is defined by the last price and it's relationship to specific moving averages.
Check the MA strategy for more specific suggestions.
Monthly: The relationship to the primary trend MA is bearish. The price in relationship to the other averages suggest short positions
Price Action:
Monthly: The average price range currently is 159.98 points/ticks/pips. Prices are currently 1.16x the normal trading range. Prices are trading within the mean range for activity. This generally indicates a healthy trading range.
While in consolidation the trade range may decrease to 98.262 points/ticks/pips.
Standard Deviation
Monthly: Standard deviation suggests a range from 1187.87 to 1433.46 for the following month.
Calculated Price Strength:
The strength of the trend in conjunction with specific averages
Monthly: Trend strength suggests a trade range of 1211.79 to 1409.53 for the following month.
Price Projection:
The price action has generated a projection signal for the underlying.
Monthly: Monthly: Price currently displays (if strength and attitude continue) a desire to move toward 956.22
If strength and attitude continue, it could take between 3 to 6 trade periods (months) to reach the projection.
Indicators Summary.
A collection of technical indicators whose directional attitude has been summarized.
Monthly: Out of the cumulative indicators monitored, 9.09% are bullish, 90.91% are bearish, 0.00% are neutral
The CCI indicator trading strategy suggest the following:
Monthly: Strongly bearish - short entries.
Confirmation Signal
6 indicators combined to confirm entry/exit.
Monthly Bearish - Open directional trades


US2000USD most likely to retraceHi Traders
US Russel 2000 is looking to come down now. This is the 4 chart and Hitman is signaling a clear down trend now. Also the RSI and the volume showing a down trend.
Target area could be something around 1200.

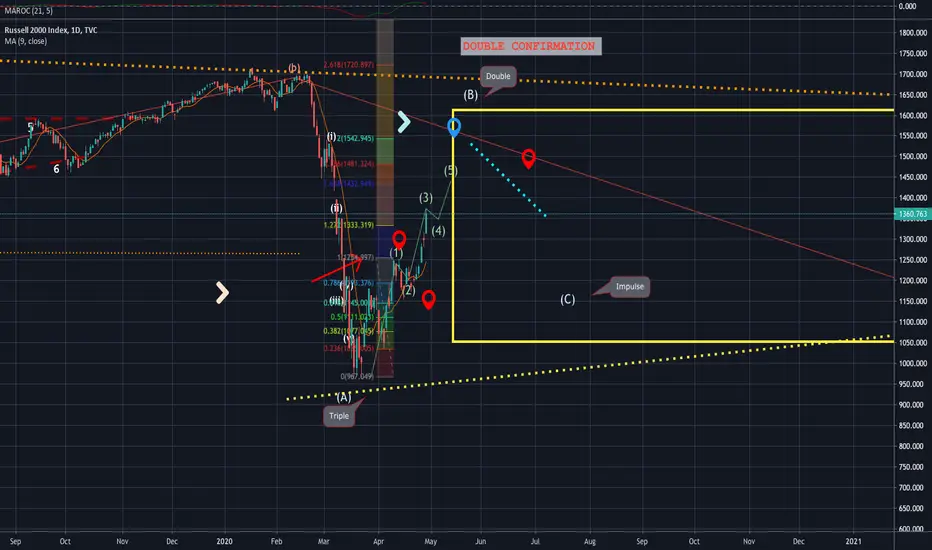
RUT wave B Rally facing SIGNIFICANT RESISTANCE RUT wave (B) rally on-going moving towards the underside of a 4 decade support-turned resistance at 1432-1542. If this is the case, bulls need to get a move on to keep the motive-looking effort going. Will the coming bear market continue this trend and see bear markets in both as US debt is shunned by global central banks as a store of value?

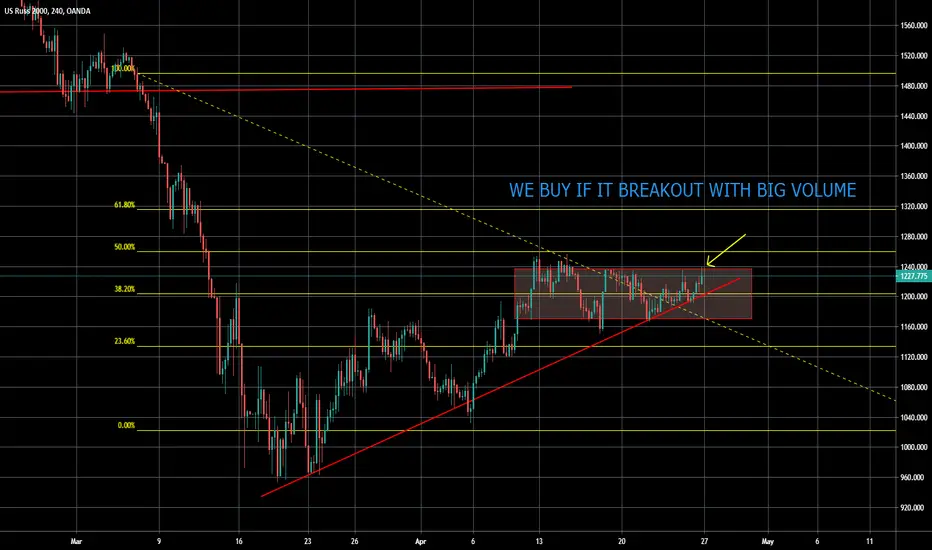
US2000 Shot term Price - one Fib for clarity Levels, and price projections, lets see can we hold it, for new highs, or we make a new low. :)

Russell 2000: Will Resistance Prove True? Trump's PriceIn technical analysis, it is said that "past support = future resistance." Looking at a chart of the Russell 2000, we see there is a level of resistance that marks the date of Donald Trump's election. This lines up with a level of resistance.
Will it hold?
If it holds, then will the Russell 2000 see lower prices in the weeks to come?
Some say that the bottom is in. Of course, I have no idea.

US2000 It's in a really interesting place!We have a wedge that it's giving us a good entry, we will wait for it when US2000 decides to retest the wedge. Be focused in this point!

RUT update for week ending 24 April 2020Weekly Data Summary Suggests:
Current Weekly Trend (price relationship to the trend MA) is Bearish
The price relationship to the moving averages currently suggest Short positions.
Current chart score suggests that Bearish Sentiment is present.
The anticipated upcoming trade range is between 1167.39 - 1281.19
Price Consolidation has formed between: 966.24 - 1396.25
If RUT is capable of maintaining the current strength as of today, the projection generated from the weekly chart is a target price of 1335.64
Out of the combined (weekly & daily) indicators monitored, 33.33% are bearish, 50.00% are bullish and 16.67% are neutral
The prices are moving with the Trending Moving Average at a standard pace with a moderate market
The RSI that monitors bullish strength has a current weekly reading of: Bearish
The RSI that monitors bearish strength has a current weekly reading of: Bearish
The strength demonstrated over the last 5 weeks is currently: Bearish
Daily Data Summary Suggests:
Current Daily Trend (price relationship to the trend MA) is Bullish
The price relationship to the moving averages currently suggest Long positions.
Current chart score suggests that Bullish Sentiment is present.
The anticipated upcoming trade range is between 1212.92 - 1260.50
Price Consolidation has formed between: 1154 - 1250
If RUT is capable of maintaining the current strength as of today, the projection generated from the daily chart is a target price of 1254.46
Price movement has returned to the Trending Moving Average this suggests either a stall while averages catch up to the prices or a turn in the prices in the opposite direction
The RSI that monitors bullish strength has a current daily reading of: Neutral Bull
The RSI that monitors bearish strength has a current daily reading of: Neutral Bull
The strength demonstrated over the last 5 days is currently: Bullish
Comments:
STD DEV:
Weekly: 1000 - 1458
Monday: 1182 - 1284
Working on a new template - I may post the new template during the week.
** If data does not significantly change between trade dates, a daily update may be skipped. Monthly and Weekly updates will always be provided. **

RUT update for week ending April 17 2020Weekly Data Summary Suggests:
Current Weekly Trend (price relationship to the trend MA) is Bearish
The price relationship to the moving averages currently suggest Short positions.
Current chart score suggests that Bearish Sentiment is present.
The anticipated upcoming trade range is between 1164.21 - 1276.65
Price Consolidation has formed between: 966.22 - 1396.25
If RUT is capable of maintaining the current strength as of today, the projection generated from the weekly chart is a target price of 1288.58
Out of the combined (weekly & daily) indicators monitored, 41.67% are bearish, 50.00% are bullish and 8.33% are neutral
The prices are moving with the Trending Moving Average at a standard pace with a moderate market
The RSI that monitors bullish strength has a current weekly reading of: Bearish
The RSI that monitors bearish strength has a current weekly reading of: Bearish
The strength demonstrated over the last 5 weeks is currently: Bearish
Daily Data Summary Suggests:
Current Daily Trend (price relationship to the trend MA) is Bullish
The price relationship to the moving averages currently suggest Long positions.
Current chart score suggests that Bullish Sentiment is present.
The anticipated upcoming trade range is between 1203.50 - 1263.99
Price Consolidation has formed between: 1154.52 - 1251.88
If RUT is capable of maintaining the current strength as of today, the projection generated from the daily chart is a target price of 1257.3
Price movement has returned to the Trending Moving Average this suggests either a stall while averages catch up to the prices or a turn in the prices in the opposite direction
The RSI that monitors bullish strength has a current daily reading of: Neutral Bull
The RSI that monitors bearish strength has a current daily reading of: Neutral Bull
The strength demonstrated over the last 5 days is currently: Bullish
** If data does not significantly change between trade dates, a daily update may be skipped. Monthly and Weekly updates will always be provided. **

Russell 2000 is heading heading down to its channel supportRussell 2000 is likely to head down to the lower side of its parallel channel, with a potential target to 1140 (1h & 4h Kijun).

Russel Target/TriggerLooking for a break below the 21EMA and the 1164 area for a trigger down. Keeping an eye on Crude and the 10YR (US10Y). I want to see Crude and the 10yr down with a break of 1164 on the Russel. Initial target of 1123.
Keep an eye on stochastic cross on daily.

ridethepig | Smoke Screens & MirrorsAfter a ruthless and cunning retrace from politicians and central bank talking heads, this piercing rally is coming to an end after reaching the full retrace target at 1250. Buyers, who would like to occupy the jurisdiction above have tried to do so in a crafty way (since the typical path looks out of the question as long as the world remains in lockdown); they have occupied the lows, driven the late sellers out of it and thus created space for this flank manoeuvre.
The RUT position arises after the typical small cap under-perofmance from the panic flows:
The analysis of this position shows us that sellers are once again ready to conduct another leg lower, but also the quick-witted buyer will know to cover on the contact of 1250. As long as this resistance holds, the advance cannot be administered and the nature of the retrace remains corrective rather than impulsive.
A fresh round of bankruptcies will be coming over the next few weeks, I am eyeballing the 16,000 lows in DOW for reference which will carry NQ, S&P, RUT, CAC, DAX, FTSE, NI and the rest of Global Equities.
Thanks as usual for keeping the support coming with likes, comments and etc!

Testing Elliot Wave skillsTesting Elliot Wave skills
Any pros out there that can critique me? lol I stick to mostly astrology


Russell 2000 Target 871Market ready for another vicious leg down. Russell 2000 could potentially touch 871.

RUT update for week ending 10 April 2020Weekly Data Summary Suggests:
Current Weekly Trend (price relationship to the trend MA) is Bearish
The price relationship to the moving averages currently suggest Short positions.
Current chart score suggests that Bearish Sentiment is present.
The anticipated upcoming trade range is between 1184.30 - 1292.50
Price Consolidation has formed between: 1396.25 - 966.22
If RUT is capable of maintaining the current strength as of today, the projection generated from the weekly chart is a target price of 1348.24
Out of the combined (weekly & daily) indicators monitored, 50.00% are bearish, 50.00% are bullish and 0.00% are neutral
The prices are moving with the Trending Moving Average at a standard pace with a moderate market
The RSI that monitors bullish strength has a current weekly reading of: Neutral Bear
The RSI that monitors bearish strength has a current weekly reading of: Bearish
The strength demonstrated over the last 5 weeks is currently: Bearish
Daily Data Summary Suggests:
Current Daily Trend (price relationship to the trend MA) is Bullish
The price relationship to the moving averages currently suggest Long positions.
Current chart score suggests that Bullish Sentiment is present.
The anticipated upcoming trade range is between 1198.46 - 1295.00
Prices have broken through the consolidation high
If RUT is capable of maintaining the current strength as of today, the projection generated from the daily chart is a target price of 1310 - 1413
Price movement has returned to the Trending Moving Average this suggests either a stall while averages catch up to the prices or a turn in the prices in the opposite direction
The RSI that monitors bullish strength has a current daily reading of: Neutral Bull
The RSI that monitors bearish strength has a current daily reading of: Neutral Bull
The strength demonstrated over the last 5 days is currently: Bullish
Comments:
STD DEV for the coming week: 1026.79 - 1466.65
STD DEV for Monday 13 April 2020: 1185.79 - 1307.66
I am flagging neutral because of the mix between weekly indicators and daily indicators pointing in opposite directions. I would need 20% of the weekly indicators to have switched direction before I stop being neutral.
Happy Easter every one! Hope you had a good holiday weekend.
Stay safe, trade safe!
** If data does not significantly change between trade dates, a daily update may be skipped. Monthly and Weekly updates will always be provided. **

Are you ready for a PUMP & DUMP ? (Russell 2000)Small caps looking a lot like Ethereum.
Everyone tried to count 5 waves up but then another wave comes into the market and trolls all the early bears.
Over 66% of people think we will go into a GREAT DEPRESSION 2.0, And trust me we will but not quite yet.
Many stocks haven't made topping patterns & others are painting false tops.
I am bullish.
Stay profitable
- Dalin Anderson

LONG US RUSS 2000 Watch lower time frame correction and buyHi there,
We are having decent bounced off on US equities. If you did not catch the bottom then wait for the lower time frame corrections and look for short term buy and keep making a profit.
OR
wait for the deeper correction or possible retest of lows again before you buy for the longer term.
Or watch my updates closely.
Good Luck
