NASDAQ - US100 (H4) - SHORT PLANNASDAQ broke strong resistance.
I now expect a retest of this breakout and a continuation of the upward movement.
For this reason, I am in a short position (high risk).
ENTRY ZONE 1: 20760
ENTRY ZONE 2: 20800
TARGET 1: 20350
TARGET 2: 20150
STOPLOSS: 20950
USATEC trade ideas

Nasdaq-100 Wave Analysis – 13 May 2025- Nasdaq-100 broke resistance area
- Likely to rise to resistance level 21500.00
Nasdaq-100 index recently broke the resistance area between the resistance level 20220.00 (which has been reversing the index from March) and the resistance trendline of the Ascending Triangle from April.
The breakout of this resistance area accelerated the active short-term ABC correction 2 from last month.
Nasdaq-100 index can be expected to rise to the next resistance level 21500.00 (target price for the completion of the active wave 2).

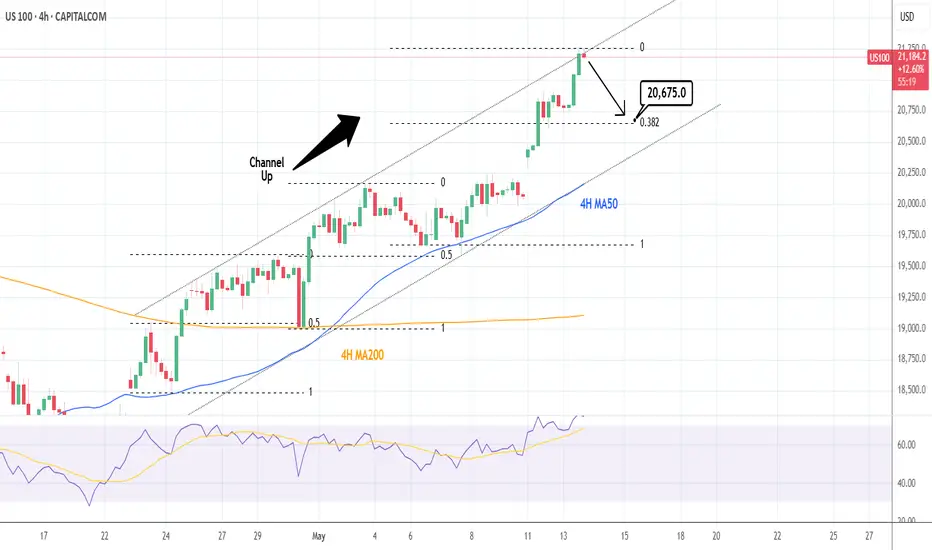
NASDAQ: Time for a 4H technical correction.Nasdaq is almost overbought on its 1D technical outlook (RSI = 69.775, MACD = 371.830, ADX = 37.524) and has reached the top of its 4H Channel Up. The two HH that the pattern has both pulled back to the 0.5 Fibonacci retracement level before the 4H MA50 provided the necessary support for the next bullish wave. Consequently we expect a small correction to at least the 0.382 Fib next (TP = 20,675).
See how our prior idea has worked out:
## If you like our free content follow our profile to get more daily ideas. ##
## Comments and likes are greatly appreciated. ##
NY pm Silver Bullet5min FVG + displacement above inflection point, confirms bulls still active. With lows being manipulated bother higher TF & lower TF. Basic RR 1:2

Lesson 12: NasDaq100 Price Consolidation and Breakout Zone NasDaq price action analysis on consolidation zone. Using a break-out strategy, we waited for price to consolidate ( $20,755-$20,812.30 zone) on the 15min timeframe to breakout at $20,812.30 for our indication, correction and bullish price continuation, targeting price at $20,888.50. Price closed above $20,888.50 (resistance) thus we hold profits until we see price reversal.

NDX - NOW IT IS ALMOST READYMorning,
I was a bit gun shy this morning for that trade - there was no rejection of resistance and it kept going, luckily without confirmation I never entered. However we are now seeing the start of a potential confirmation to retest down to previous support.
Hourly:
Oversold RSI with two tops forming.
Volume is starting to dip and has rejected higher volume profile.
Momentum is starting to top out just waiting to see if it wavers downwards.
Just waiting on that candle to close lower on the hourly and will continue following if our RSI crosses the EMA point.
I know being patience sucks but its better than loosing money!
Enjoy

Perspective CheckOANDA:NAS100USD | OANDA:SPX500USD – Perspective Check
We’ve moved nearly 5,000 points from the April lows on NASDAQ, and over 1,000 points on the S&P 500. Yet despite that clear, tradeable move, many are still waiting — either for a crash that hasn’t come, or a runaway rally that already happened.
Let’s keep it simple:
Say you caught just 50–60% of the NASDAQ move. That’s 2,500 to 3,000+ points. If you layered in properly, shaved risk, locked profits, and rode the structure, that’s meaningful ground gained — not theoretical, not hindsight — just reactive, structured trading.
But here’s the friction point:
The hardest psychological shift isn’t finding entries. It’s accepting when:
You’re wrong
The market has changed
It’s time to let go of a losing bias
Ask around, and you’ll hear it:
“I want it to drop because my TA says X”
or
“I need it to break even — I’m stuck in a position”
That’s not analysis. That’s hope. We always return to this principle:
Trade what’s happening, not what you want to happen.
Take profits, not chances.
You don’t need the full move. You just need enough of it, often enough, with a process that protects your edge. The rest is just noise dressed up as conviction.

Hanzo : NAS100 15m: Bearish Confirmed After Liquidity Trap Done🔥 NAS100 – 15 Min Scalping Analysis (Bearish Setup)
Bias: Bearish
Time Frame: 15 Min
Entry Type: Confirmed Entry After Liquidity Sweep 21200
🩸 Key Reasons for Entry:
☄️Price manipulated above previous high (liquidity grab trap).
☄️Strong rejection from key supply zone with SMC confluence.
☄️Bearish order block + break of market structure.
☄️Entry respects higher timeframe resistance level.
🔤 Fair value gap / imbalance completed.
🔻Setup aligned with institutional reversal window
Target: Next 15M demand zone / 1:3+ RR
Status: trade active 👌
X2: NQ/US100/NAS100 Long - Day Trades 1:2X2:
Risking 1% to make 2%
NAS100, US100, NQ, NASDAQ Long for day trade, with my back testing of this strategy, it hits multiple possible take profits, manage your position accordingly.
Risking 1% to make 2%
Use proper risk management
Looks like good trade.
Lets monitor.
Use proper risk management.
Disclaimer: only idea, not advice

US100, NQ BearishAM Session my analysis says that we will go lower during 10:00 AM NY.
Equal lows from London and trendline liquidity since London.

NASS100 triangle breakoutdescending triangle in a up trend i wait for a clean breakout on the 5 m TF

US 100 IndexNAS100 Index
- Bullish Channel as an corrective pattern in short time frame
- Demand Zone
- Break of Structure
- Completed " 123 " Impulsive Waves
- Fair Value Gap

Nasdaq Tests Key 20,900 ResistanceAs shown in chart above, price action is hovering near the neckline of a well-defined double top pattern, formed between December 2024 and February 2025, similarly across the Dow and SPX500 charts.
This reinforces a key resistance zone that could either validate a more sustainable bullish outlook into 2025 — or trigger another correction if rejected.
Nasdaq Upside Scenario: A confirmed hold above 20,900 may extend gains toward 21,500, and 22,200.
Downside Scenario: A pullback below 20900 and 20,500 could find support at 20,200, 19,600, and 19,170, respectively.
Markets are currently holding on trade optimism, yet key economic reports are likely to test the narrative
Written by Razan Hilal, CMT

NASDAQ SHORT1. All timeframes are massively overbought with RSI
2. There is a triple top on H1 and H4 with a lot of divergence
3. Trend is still up, so look to exit with any indicator
4. There is a AB=CD pattern on H1 and H4 which shows that this trade will finally retrace
5. Target 1 is at 20200
6. Previous days high is not broken which shows there is a lot of resistance at this level.

Nasdaq 100 breaks above 200MA: is the bull market back?The Nasdaq 100 is once again trading above its 200-day moving average after spending 64 days below it. Breaks like this often signal major moves ahead. Watch the video to learn more.
This content is not directed to residents of the EU or UK. Any opinions, news, research, analyses, prices or other information contained on this website is provided as general market commentary and does not constitute investment advice. ThinkMarkets will not accept liability for any loss or damage including, without limitation, to any loss of profit which may arise directly or indirectly from use of or reliance on such information

US 100 - Could The Recovery Continue?A press conference yesterday morning led by US Treasury Secretary Bessant and Trade representative Greer outlined a positive conclusion to the first round of trade talks between the US and China. The news grabbing headline was a 90 day reduction in combined US levies on Chinese imports being reduced from 145% to 30% and Chinese duties on US goods dropping from 125% to 10%.
This announcement put a further squeeze on weak short equity positions, and gave fresh impetus to the bulls, helping to fuel a 4% rally in the US 100, taking it above some interesting technical levels (more on this below).
Now, with a framework in place for further talks between the world’s two biggest economies, representatives from the two countries have 90 days to work towards a broader agreement. However, US Treasury secretary Bessant did say that there may be a chance to extend the tariff reduction for a longer period if there is good faith, engagement and constructive dialog to keep moving forward. A slight caveat which outlines the huge amount of negotiation and focus that needs to be maintained from both sides to finalise a more long term agreement.
While traders may still be focused on trade negotiations and potential trade deal updates with allies across the rest of this week, there is also some economic data to focus on. The latest US inflation reading in the form of CPI is due out later today at 1330 BST, where any deviation from market expectations may either add further buying momentum to the recent move higher, or give traders a reason to take profits against some potentially important technical levels.
Technical Update: Breakout From the Late March Highs
With a positive reaction to the US/China trade talks seen in US equities, the US 100 index has posted its highest closing level since February 26th 2025, as price strength has continued to emerge from the capitulation to 16290 on April 7th.
Traders are possibly now viewing the ability of the index to close above 20871, the March 25th session high, as something that may lead to a more sustained period of price strength.
Of course, a break of a previous price high isn’t always a guaranteed signal of price strength, but with the constructive pattern of higher price highs and higher price lows in place since the April 7th low (16290), the question may now be asked, what are the next potential resistance levels to current strength?
Potential Resistance Levels:
Having seen a new recovery price high for the current phase of strength posted on Monday at 20914, traders may now be viewing this level as a possible first resistance, and how this level is defended on a closing basis could be important.
However, following the latest price strength, if closes above this 20914 high were to materialise, traders might then shift their focus to 22226, which is the February 18th all-time high, as the next possible resistance area.
Potential Support Levels:
Of course, much depends on future market sentiment and price trends, and we know price strength can quickly fail, even reverse back to the downside. So, we must be aware of possible support levels that if broken, may see risks to turn towards potential of declines.
A support focus might now be half of the latest price strength seen from last week’s low, which stands at 20252. If this level gives way, a deeper decline might then be on the cards back towards 19627, which is equal to the 38.2% Fibonacci retracement of April to May 2025 strength.
The material provided here has not been prepared in accordance with legal requirements designed to promote the independence of investment research and as such is considered to be a marketing communication. Whilst it is not subject to any prohibition on dealing ahead of the dissemination of investment research, we will not seek to take any advantage before providing it to our clients.
Pepperstone doesn’t represent that the material provided here is accurate, current or complete, and therefore shouldn’t be relied upon as such. The information, whether from a third party or not, isn’t to be considered as a recommendation; or an offer to buy or sell; or the solicitation of an offer to buy or sell any security, financial product or instrument; or to participate in any particular trading strategy. It does not take into account readers’ financial situation or investment objectives. We advise any readers of this content to seek their own advice. Without the approval of Pepperstone, reproduction or redistribution of this information isn’t permitted.

BULLISH SETUP ON NASBullish flag right before the resistance, it could strongly help break above.20.993

NAS100USD: Rejection Block & Breaker Converge for Sell SetupMarket Context:
In today’s analysis of NAS100USD, we note that although the market has been trading within bullish institutional order flow, current price action is presenting multiple signs that a bearish reversal may be underway. Institutional behavior appears to have shifted, particularly after liquidity was swept and price began to respect resistance zones.
Key Observations:
Premium Buy Stop Sweep:
Price action swept the swing high rather than breaking it cleanly, indicating a stop raid. This is a common smart money tactic used to engage with buy stop liquidity in premium pricing before reversing.
Rejection Block Formation:
A sharp rejection followed the liquidity sweep, leaving behind a Rejection Block—a powerful institutional resistance zone. This suggests the institutions placed sell orders against willing buyers and are defending this level.
Market Structure Shift:
We observe a break in internal structure to the downside, further confirming that the prior bullish order flow may now be transitioning into a bearish phase.
Breaker Block Retest:
Price has retraced into a Breaker Block, where institutions typically revisit prior zones of buying to mitigate exposure and initiate new sell positions. This zone is reinforced by alignment with the previous buy stop sweep, providing a high-value confluence area for short opportunities.
Trading Plan:
Entry Strategy:
Await confirmation within the breaker on the lower timeframes. Once confirmed, these zones offer a strong institutional case for short positioning.
Targets:
Focus on discount liquidity pools as the primary objective. Selling from premium levels with the intention of targeting undervalued zones mirrors institutional execution models.
Stay aligned with smart money behavior—observe, confirm, and act with precision.
Happy Trading!
The Architect

Nasdaq-100 H4 | Falling toward a pullback supportThe Nasdaq-100 (NAS100) is falling towards a pullback support and could potentially bounce off this level to climb higher.
Buy entry is at 20,336.30 which is a pullback support.
Stop loss is at 19,500.00 which is a level that lies underneath an overlap support and the 23.6% Fibonacci retracement.
Take profit is at 21,500.25 which is a pulback resistance that aligns with the 127.2% Fibonacci extension.
High Risk Investment Warning
Trading Forex/CFDs on margin carries a high level of risk and may not be suitable for all investors. Leverage can work against you.
Stratos Markets Limited (tradu.com):
CFDs are complex instruments and come with a high risk of losing money rapidly due to leverage. 63% of retail investor accounts lose money when trading CFDs with this provider. You should consider whether you understand how CFDs work and whether you can afford to take the high risk of losing your money.
Stratos Europe Ltd (tradu.com):
CFDs are complex instruments and come with a high risk of losing money rapidly due to leverage. 63% of retail investor accounts lose money when trading CFDs with this provider. You should consider whether you understand how CFDs work and whether you can afford to take the high risk of losing your money.
Stratos Global LLC (tradu.com):
Losses can exceed deposits.
Please be advised that the information presented on TradingView is provided to Tradu (‘Company’, ‘we’) by a third-party provider (‘TFA Global Pte Ltd’). Please be reminded that you are solely responsible for the trading decisions on your account. There is a very high degree of risk involved in trading. Any information and/or content is intended entirely for research, educational and informational purposes only and does not constitute investment or consultation advice or investment strategy. The information is not tailored to the investment needs of any specific person and therefore does not involve a consideration of any of the investment objectives, financial situation or needs of any viewer that may receive it. Kindly also note that past performance is not a reliable indicator of future results. Actual results may differ materially from those anticipated in forward-looking or past performance statements. We assume no liability as to the accuracy or completeness of any of the information and/or content provided herein and the Company cannot be held responsible for any omission, mistake nor for any loss or damage including without limitation to any loss of profit which may arise from reliance on any information supplied by TFA Global Pte Ltd.
The speaker(s) is neither an employee, agent nor representative of Tradu and is therefore acting independently. The opinions given are their own, constitute general market commentary, and do not constitute the opinion or advice of Tradu or any form of personal or investment advice. Tradu neither endorses nor guarantees offerings of third-party speakers, nor is Tradu responsible for the content, veracity or opinions of third-party speakers, presenters or participants.

Technical Breakdown on US 100 | 1H TimeframeTechnical Breakdown on US 100 Cash CFD (1H) using Volume Profile, Gann, and CVD + ADX
1. Key Observations (Volume, Gann & CVD + ADX Focused)
a) Volume Profile Insights:
Value Area High (VAH): 20,780
Value Area Low (VAL): 20,020
Point of Control (POC):
Recent: 20,066.23
Historical: 19,824.71
High-volume nodes: Dense volume around 19,820–20,070 suggests strong accumulation
Low-volume gaps: 20,200–20,400 and 20,600–20,780 (rapid price movement zones)
b) Liquidity Zones:
Stops likely clustered:
Below 20,070 (last breakout support)
Above 20,800 (recent intraday high)
Absorption zones: Near 20,066 – notable price base before rally; high delta confirms buying interest
c) Volume-Based Swing Highs/Lows:
Swing High: 20,808 – fresh high with slowing momentum, possible exhaustion
Swing Low: 19,824.71 – firm bottom established, high volume zone pre-breakout
d) CVD + ADX Indicator Analysis:
Trend Direction: Strong uptrend confirmed by consistent CVD rise and price breakout
ADX Strength:
ADX > 20 with DI+ > DI- – Confirmed bullish trend
CVD Confirmation:
Rising CVD + sustained price breakout = strong buyer demand in the rally leg
2. Support & Resistance Levels
a) Volume-Based Levels:
Support:
20,066.23 (POC and structural breakout base)
19,824.71 (historical accumulation and value base)
Resistance:
20,808 (recent high)
21,000 (psychological level + projected target zone)
b) Gann-Based Levels:
Confirmed Swing Low (Gann): 19,824.71
Retracement Levels from 20,808 High:
1/2: 20,316
2/3: 20,482 (key support if price dips)
3. Chart Patterns & Market Structure
a) Trend: Bullish trend established (confirmed by CVD & ADX)
b) Notable Patterns:
Breakout from consolidation with volume near 20,066
Parallel ascending channel forming – healthy trend structure
Price currently testing upper boundary of channel – watch for breakout or pullback
4. Trade Setup & Risk Management
a) Bullish Entry (If CVD + ADX confirm uptrend):
Entry Zone: 20,320 – 20,400 (pullback into Gann retracement zone)
Targets:
T1: 20,808 (prior high)
T2: 21,100 (channel projection + round level)
Stop-Loss (SL): 20,020 (below VAL + swing low support)
RR: Minimum 1:2
b) Bearish Entry (If CVD + ADX confirm downtrend):
Entry Zone: 20,800 – 20,850 (if rejection pattern forms with falling CVD)
Target:
T1: 20,066 (volume base)
Stop-Loss (SL): 21,100
RR: Minimum 1:2
c) Position Sizing:
Risk only 1–2% of capital per trade, based on distance from entry to SL

SELLS LOOK VERY INTERESTINGI'm Focusing on that 1hr FVG For London Session. once we get there i'll be looking for an 5mins CISD.

lazy bullsI guess we need something to make bulls work, cuz i don't know what we are doing if it is not buying.

NASDAQ Bullish Breakout Above Channel;📈 Technical Analysis Overview
1. Breakout from Downtrend Channel
The price has clearly broken out of a descending channel, confirmed by a clean breakout above the upper trendline.
This is a bullish signal, indicating the end of the prior downtrend and the start of a possible uptrend or reversal.
2. Moving Averages (EMA 50 & EMA 200)
EMA 50 (Red): 18,965
EMA 200 (Blue): 19,409
Price is currently trading above both EMAs, which is another strong bullish indicator.
A bullish crossover (where EMA 50 crosses above EMA 200) is likely imminent if upward momentum continues—this would form a Golden Cross, further confirming bullish sentiment.
3. Structure and Market Behavior
After the breakout, price retested the breakout zone and showed a bounce, forming a higher low, which is characteristic of a bullish structure.
The chart includes projected price action with higher highs and higher lows—suggesting a bullish continuation pattern.
4. Volume & Momentum (Not shown but implied)
Breakouts are typically validated by volume. Although volume is not shown, the sharp upward movement and breakout above resistance suggest strong buying pressure.
🔍 Key Levels to Watch
Resistance: 20,000 psychological level; above that, 20,500–21,000 may act as resistance.
Support: 19,400 (near EMA 200), and 18,965 (EMA 50); a break below may invalidate the bullish setup.
📊 Conclusion
The chart shows a clear breakout from a descending channel, supported by the price moving above both key EMAs. The structure favors bullish continuation, especially if price holds above the 19,400–19,500 support zone. Upside targets lie around 20,500 to 21,000.
