USNAS100 Consolidates Between 22815–22705 | Breakout Will DefineUSNAS100 – Technical Outlook
The NASDAQ remains under pressure amid ongoing tariff uncertainty, with traders closely watching for any progress in negotiations or signs of escalation.
Currently, the price is consolidating between 22815 and 22705, awaiting a breakout to define the next directional move.
A 1H candle close below 22705 would confirm bearish continuation, targeting 22600, with further downside potential toward 22420.
A break above 22815 would shift momentum bullish, opening the way to 22880, followed by 23010.
Key Levels:
Support: 22600 / 22420
Resistance: 22815 / 22880 / 23010
USATEC trade ideas

Nas100 is Still Correcting Nasdaq is Correcting
Long Term we are still Bullish
Remember that markets hunt liquidity
The short term trend is Lower Highs and Lower Lows
Price is still in Premium For Sells
Looking for a retest of previous short term high and my TP would be around 22580
The only way I would get into a buy trade if price would retest the current support and hold with very bullish price action. No little candles etc.

Nasdaq Analysis 07-Jul-25In this video we are discussing the main fundamental reason behind Nasdaq bullish momentum.
In addition to area if interest with possible scenarios.
Disclaimer: easyMarkets Account on TradingView allows you to combine easyMarkets industry leading conditions, regulated trading and tight fixed spreads with TradingView's powerful social network for traders, advanced charting and analytics. Access no slippage on limit orders, tight fixed spreads, negative balance protection, no hidden fees or commission, and seamless integration.
Any opinions, news, research, analyses, prices, other information, or links to third-party sites contained on this website are provided on an "as-is" basis, are intended only to be informative, is not an advice nor a recommendation, nor research, or a record of our trading prices, or an offer of, or solicitation for a transaction in any financial instrument and thus should not be treated as such. The information provided does not involve any specific investment objectives, financial situation and needs of any specific person who may receive it. Please be aware, that past performance is not a reliable indicator of future performance and/or results. Past Performance or Forward-looking scenarios based upon the reasonable beliefs of the third-party provider are not a guarantee of future performance. Actual results may differ materially from those anticipated in forward-looking or past performance statements. easyMarkets makes no representation or warranty and assumes no liability as to the accuracy or completeness of the information provided, nor any loss arising from any investment based on a recommendation, forecast or any information supplied by any third-party.

Long position idea on Nasdaq Simple and precise idea of Nasdaq. Bullish momentum in full swing. Nasdaq recently broke out of the previous High/Resistance and shows that the bulls are still in power. Take profit is at 25.000.00 because Nasdaq usually moves around 10.000 pips after a market crash so when doing my calculations from previous Low of 16300, my estimation is around 25000 which equals to 9,000 - 10,000 pips.

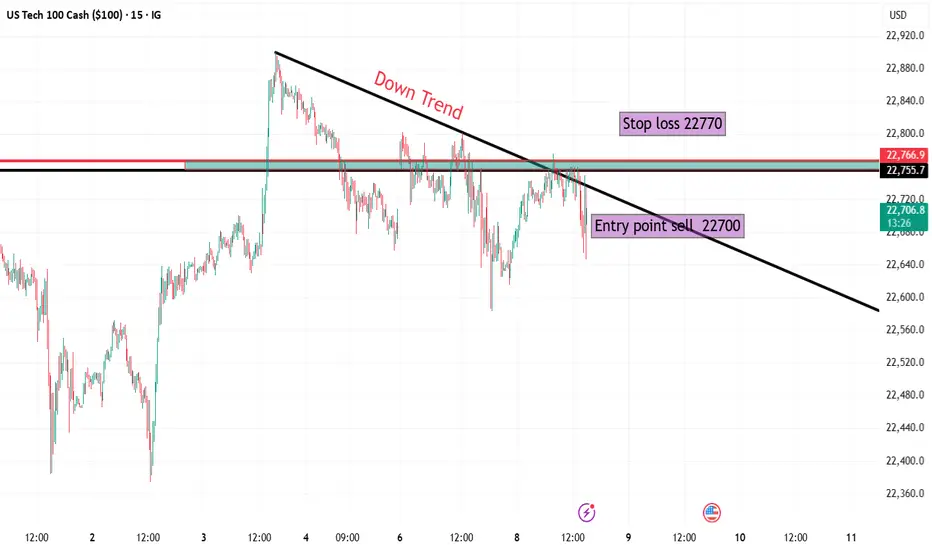
NASDAQ 🔍 Market Overview:
Instrument: US Tech 100 (NASDAQ 100)
Timeframe: 15 Minutes
Current Trend: Short-term downtrend, indicated by the descending trendline connecting recent lower highs.
📉 Trade Setup (Short Position):
Entry Point: 22,700
Price has broken below the trendline and a horizontal resistance zone around 22,750–22,770, confirming bearish pressure.
Stop Loss: 22,770
Placed just above the previous resistance and trendline. A break above this level would invalidate the downtrend structure.
Target: 22,070
This level aligns with a previously tested demand/support zone, offering a logical take-profit area.
📊 Risk/Reward Analysis:
Risk: ~100 points
Reward: ~640 points
Risk-to-Reward Ratio: 1:6, which is excellent and indicates a high potential reward relative to the risk.
📌 Technical Observations:
Trendline: Clearly established downtrend with lower highs.
Breakout Confirmation: Price rejected from trendline + horizontal resistance = confluence zone.
Volume & Momentum (not shown but advisable to check): Traders should confirm the breakout with increased selling volume or bearish momentum indicators (e.g., RSI dropping below 50 or MACD crossing down).
✅ Conclusion:
This is a well-structured short (sell) setup with:
Clear trendline rejection,
Defined entry, stop loss, and target,
A favorable risk-to-reward ratio.
Bear signalsLooking for 22500 Im thinking. Banks trade the round numbers and the round numbers for nas are 125 point increments

NASDAQ Bulls Defend Pivot – Can 23,000 Break Next?USNAS100
The Nasdaq 100 is currently holding above the pivotal 22,720 level, supported by market optimism amid recent tariff-related developments from the White House.
Bullish Scenario:
Sustained price action above 22,720 keeps bullish momentum intact. A break and 1H close above 22,815 would confirm strength, opening the path toward the psychological milestone and potential all-time high at 23,000.
Bearish Breakdown:
A 1H or 4H close below 22,720 would invalidate the bullish bias and strengthen downside pressure, with initial support seen at 22,615 and deeper correction likely toward 22,420.
Key Technical Levels:
• Resistance: 22,815 · 23,000
• Support: 22,615 · 22,420

NASDAQ After the Fireworks: Bearish Setup LoadedAfter the classic 4th of July rally, I stepped in on the short side of Nasdaq, targeting 22,000 and 21,400 zones. The market structure shows exhaustion, and with the cloud retest failing to hold new highs, I positioned accordingly.
Technical:
• Price stalled at prior expansion highs with tight compression near 23,000.
• Daily FibCloud offered resistance confirmation.
• Bearish risk-reward skew forms after extended rally and thin retraces.
• Volume divergence spotted.
Fundamentals:
Multiple overlapping uncertainties:
• Trump confirmed tariffs will take effect on August 1, threatening a 10% surcharge on BRICS-aligned nations.
• Treasury Secretary Bessent anticipates several trade deal announcements within 48h—but stresses quality over quantity.
• Bank of America maintains its base case of 0 rate cuts in 2025, citing strong economic data and sticky inflation risks.
The combination of tariff escalation, hawkish monetary expectations, and global trade friction creates a perfect backdrop for volatility and correction—especially in overextended tech indices like the Nasdaq.
Note: Please remember to adjust this trade idea according to your individual trading conditions, including position size, broker-specific price variations, and any relevant external factors. Every trader’s situation is unique, so it’s crucial to tailor your approach to your own risk tolerance and market environment.

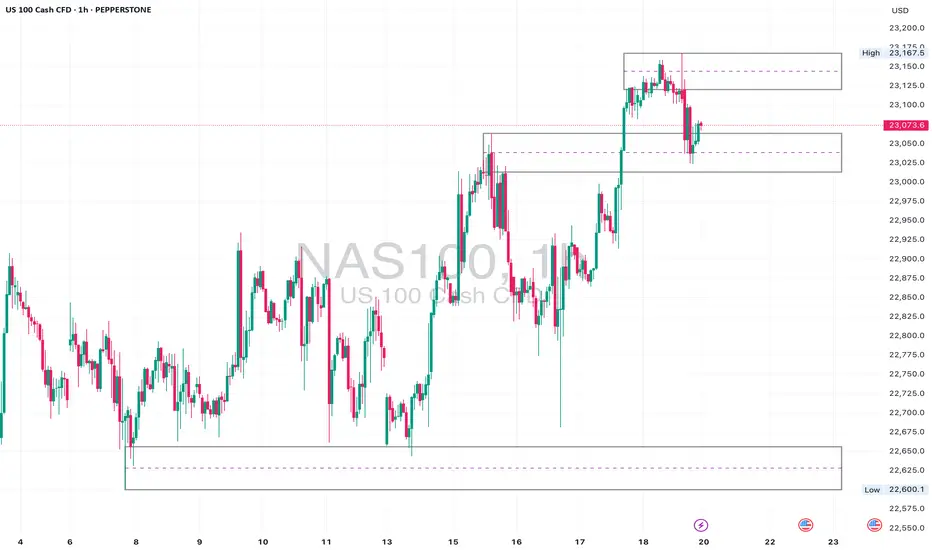
US100 Resistance Cluster Above!
HI,Traders !
#US100 made a bearish
Breakout of the support
Cluster of the rising and
Horizontal support levels
Which is now a resistance
Cluster round 22703.9 then
Went down and made a local
Pullback on Monday but we are bearish
Biased mid-term so we
Will be expecting a further
Bearish move down this week !
Comment and subscribe to help us grow !

Bollinger Bands: How to Stop Being a Slave to the Markets.Bollinger Bands are a technical analysis indicator widely used in trading to assess the volatility of a financial asset and anticipate price movements. Created in the 1980s by John Bollinger, they consist of three lines superimposed on the price chart:
The middle band: a simple moving average, generally calculated over 20 periods.
The upper band: the moving average to which two standard deviations are added.
The lower band: the moving average to which two standard deviations are subtracted.
These bands form a dynamic channel around the price, which widens during periods of high volatility and narrows when the market is calm. When a price touches or exceeds a band, it can signal an overbought or oversold situation, or a potential trend reversal or continuation, depending on the market context.
What are Bollinger Bands used for?
Measuring volatility: The wider the bands, the higher the volatility.
Identify dynamic support and resistance zones.
Detect market excesses: A price touching the upper or lower band may indicate a temporary excess.
Anticipate reversals or consolidations: A tightening of the bands often heralds an upcoming burst of volatility.
Why is the 2-hour time frame so widely used and relevant?
The 2-hour (H2) time frame (TU) is particularly popular with many traders for several reasons:
Perfect balance between noise and relevance: The H2 offers a compromise between very short time frames (often too noisy, generating many false signals) and long time frames (slower to react). This allows you to capture significant movements without being overwhelmed by minor fluctuations.
Suitable for swing trading and intraday trading: This TU allows you to hold a position for several hours or days, while maintaining good responsiveness to take advantage of intermediate trends.
Clearer reading of chart patterns: Technical patterns (triangles, double tops, Wolfe waves, etc.) are often clearer and more reliable on H2 than on shorter time frames, making decision-making easier.
Less stress, better time management: On H2, there's no need to constantly monitor screens. Monitoring every two hours is sufficient, which is ideal for active traders who don't want to be slaves to the market.
Statistical relevance: Numerous backtests show that technical signals (such as those from Bollinger Bands) are more robust and less prone to false signals on this intermediate time frame.
In summary, the 2-hour time frame is often considered "amazing" because it combines the precision of intraday trading with the reliability of swing trading, thus providing superior signals for most technical strategies, particularly those using Bollinger Bands.
To summarize
Bollinger Bands measure volatility and help identify overbought/oversold areas or potential reversals.
The 2-hour timeframe is highly valued because it filters out market noise while remaining sufficiently responsive, making it particularly useful for technical analysis and trading decision-making.

Technical Analysis – NAS100 (15min)Chart Overview Date: July 7, 2025
Market: NAS100 (US Tech 100 Index)
Timeframe: 15-Minute
Chart Context: Clean with Price Action Focus
🧠 Market Structure
Overall uptrend structure since June 21st – higher highs and higher lows.
Key resistance zone: 22,900 – price was rejected here multiple times.
Support area: 22,500 – formed after bullish impulsive move and retest.
🎯 Entry Scenario
Currently in a sideways consolidation between 22,700 – 22,900.
A break above 22,900 with strong volume can lead to a bullish continuation.
Alternatively, a rejection near 22,900 with bearish engulfing candle may offer a short scalp back toward 22,700.
📈 Bias & Confirmation
Trend Bias: Bullish
Wait for:
Breakout and close above resistance for long.
Rejection and bearish signal at resistance for short.
📌 Plan
Type Trigger SL TP Target 1 TP Target 2
Long Break & close >22,900 <22,800 23,050 23,150
Short Rejection @22,900 >22,950 22,720 22,600
"📊 Clean and structured technical analysis on NAS100 – Currently consolidating after a strong uptrend. Watching key levels around 22,900 for breakout or rejection scenario.
Trade safe. 📈 #ALIPFX #TechnicalAnalysis #NAS100"

NASDAQ Potential Bearish Reversal Analysis NASDAQ Potential Bearish Reversal Analysis 🧠🔻
The chart illustrates a potential bearish setup forming after a recent uptrend in NASDAQ. Let's break it down professionally:
🔍 Technical Overview:
Ascending Trendline Break ✅
Price had been respecting a steady ascending trendline.
A break below this trendline indicates a possible momentum shift from bullish to bearish.
Bearish Pattern Formation 🔷
A bearish flag/pennant-like formation can be observed after the sharp rise.
This consolidation followed by a breakdown could be a continuation pattern, hinting at further downside.
Resistance Rejection 🔴
A red arrow marks a clear rejection from the resistance zone near 22,800 USD.
Strong wick rejections and bearish candles suggest selling pressure at that level.
Support Turned Resistance (SUPPOT 🛑)
The previously broken support zone is now acting as resistance (note: "SUPPOT" appears misspelled—should be "SUPPORT").
Bearish Target Zone 🎯
The chart marks a "TAEGET" zone (should be "TARGET") near the 21,900 – 22,000 USD range.
This aligns with prior consolidation and demand zones, making it a likely area for price to retrace.
📌 Key Zones:
Resistance (Rejection Area): 22,800 USD
Current Price: 22,739.7 USD
Bearish Target Zone: 21,900 – 22,000 USD
⚠️ Conclusion:
The market shows signs of a bearish reversal with a confirmed trendline break, resistance rejection, and bearish pattern formation. If the price fails to reclaim the 22,800 level, there’s a high probability of downward continuation toward the 22,000 target.

CALL THE MARKETS - XAUUSD ANALYSISWE HAVE
ona
kyle
Hasan
Ashlee
Mav
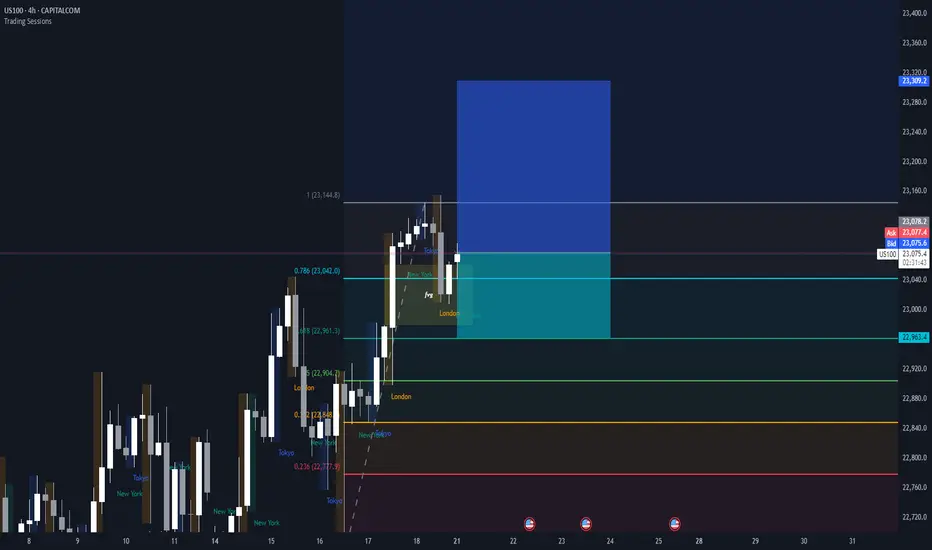
We are looking for the new red candle to drop down to 23100 area. from the 23100 to see continuation or a reversal towards ATH for a rejection to continue down to our lower Blue square area.
obviously we will wait for more news but thats what we are looking a for now.

US100 longLet market structure speak for itself! ;)
Looks like a clear long position... follow the trend!!!! <3
Nas100• Daily: Price is nearing the upper boundary of a rising wedge pattern — showing signs of overextension.
• 4H: Strong bullish structure with clean breaks and retests of minor consolidation ranges.
• 1H: Small range developing after recent high. A deeper pullback to 22,960–22,880 would offer a cleaner entry for continuation.
⚠️ Watch For:
• Wedge resistance on the daily chart.
• Bullish continuation only valid above 23,040.
• If we break below the 4H support zone (around 22,880), short-term pullbacks are likely.
NAS100 Weekly Surge: Momentum vs. Caution at 23,384In this weekly chart breakdown of the NAS100, we spotlight a strong bullish close that hints at potential continuation to the upside. Using technical confluence and Fibonacci extension levels, the analysis maps a path toward the projected target of 23,384. However, viewers are cautioned—while momentum appears strong, the proximity to the Fib threshold warrants measured optimism. This level could attract profit-taking or spark volatility, making risk management key as price approaches this potential inflection point.
I hope you find value in this analysis for your own trading and investment decision. If you like these analysis please give it a boost, check out my YouTube Channel for weekly insightful analysis. Link in the bio.
Thank you for your time and attention and I wish you a very profitable trading week. Cheers!!

NAS100 - Pattern & SMA PerspectiveDear Friends in Trading,
How I see it,
Not much new to report...
Exhaustion rising wedge continuation
1) Short corrections, new demands keep forming.
2) Can price break out to ignite an even steeper climb?
3) Or will price keep on respecting the wedge above 22900?
4) Still no catalyst to ignite a free fall...
I sincerely hope my point of view offers a valued insight.
Thank you for taking the time study my analysis.

7/21/25 ((NAS100)) analysisPrice is definitely going up
may come down to quickly tap the daily FVG first
perhaps in the beginning of the week
---Monday/Tuesday style but not married to that Idea
could also come back to hit that volume weekly line thing
I just decided to implement lol who knows
anyways I plan to be in BUYS all week long BABYYY

Nasdaq Long 7.17.25At 9 AM, price bounced off of the PD high which signified that price wanted to distribute above the current week high, old day high. I entered at 10 AM off the 9 AM candle. Awesome trade and execution.

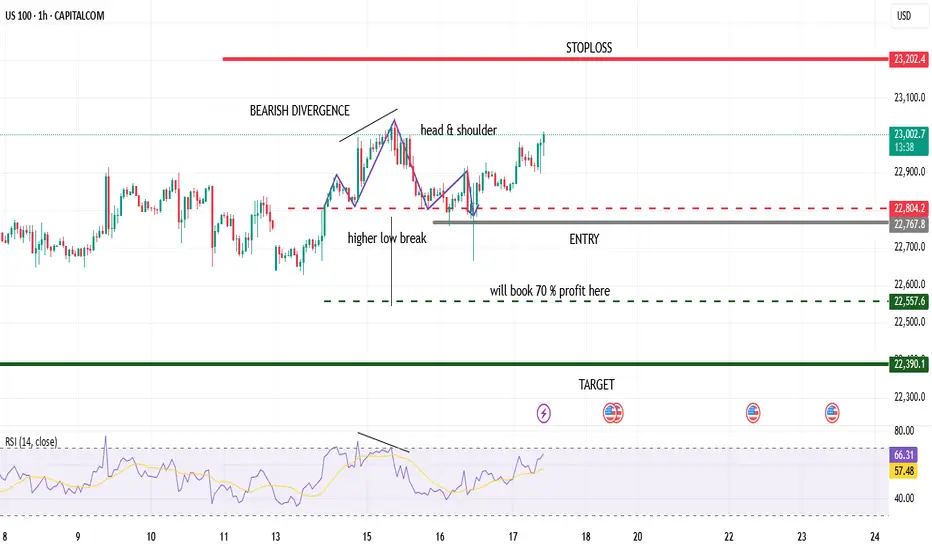
US 100 ShortUS 100 short
1st us100 formed bearish divergence
then break last higher low
also formed bearish head & shoulder
DXY index is bullish it also indicates for bearish stock
Nasdaq100 Bulls ready to drive the price to 23,300 handle With the choch on the market structure and with Key data released on Thursday, reflected strength in the U.S. economy. Stocks rose this Thursday, buoyed by fresh economic data reports and a slew of corporate earnings releases. The tech-heavy Nasdaq Composite has advanced 0.4%, and quarterly earnings reports released this week have exceeded Wall Street’s expectations, fueling investor confidence. I am expecting that by the end of this week or the beginning of next week will see the bulls drive the market to our 23,300 handle. I am with the bulls on this one
Tp1.23,300.

NAS100 - Follow Progress 3Dear Friends in Trading,
How I see it,
Remember:
"NASDAQ IS IN EXTREME GREED/OVERBOUGHT TERRITORY"
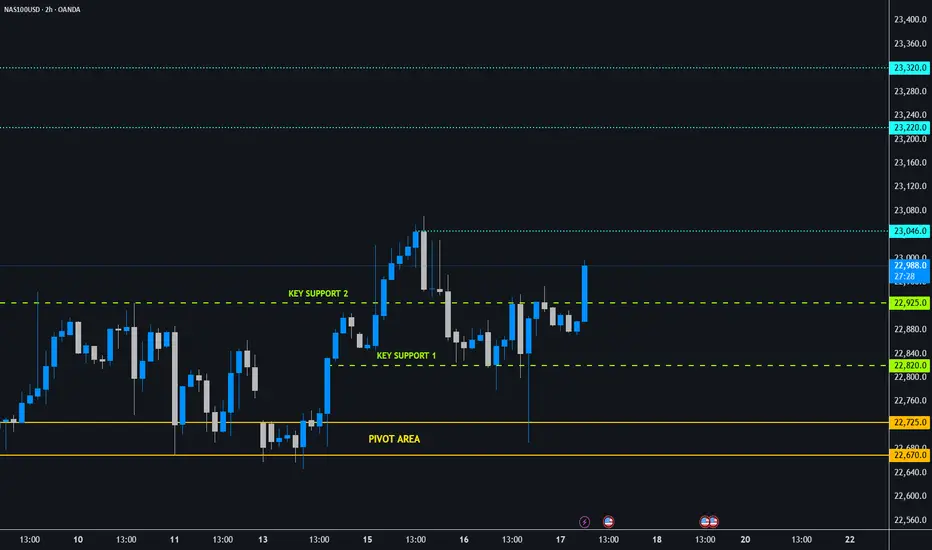
1) NASDAQ formed new key support/demand levels post CPI + PPI
2) Price needs to stabilize above 23046 next.
3) As long as both key support levels hold, the potential for more
bull runs remains high.
I sincerely hope my point of view offers a valued insight.
Thank you for taking the time to study my analysis.
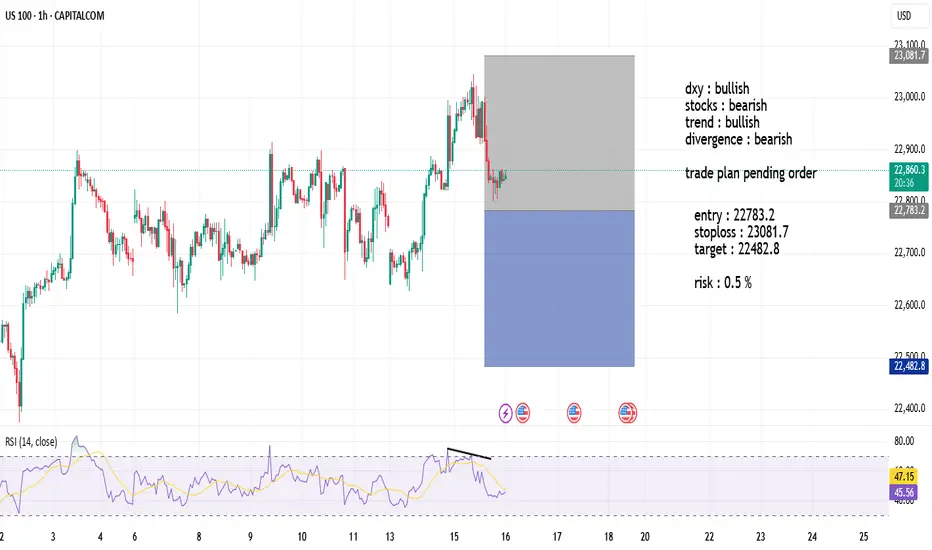
US100 SHORT dxy : bullish
stocks : bearish
trend : bullish
divergence : bearish
trade plan pending order