US100/Analysis *📊 US100 (NAS100) – 4H Analysis & Trade Signal*
---
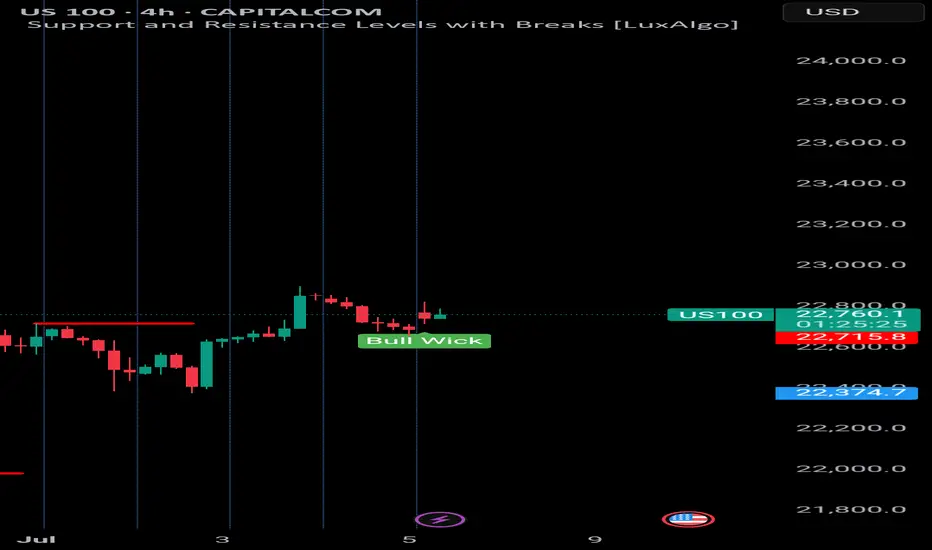
*🔎 Chart Observation:*
- *Current Price:* 22,764
- *Structure:* Market rejected downside strongly with a *Bull Wick* (demand zone reaction).
- *RSI (14):* 60.38
- Momentum is rising again, just under overbought.
- *Bearish divergence* still visible, but price is defending structure.
---
*📌 Key Levels:*
- *Support:* 22,715
- *Resistance:* 22,865 → 23,000
- *Strong Bullish Zone:* 22,720–22,750
---
*📈 Trade Idea: BUY Setup*
- *Entry:* 22,760–22,770
- *SL:* 22,690 (below wick)
- *TP1:* 22,865
- *TP2:* 23,000
- *TP3 (optional):* 23,150 if breakout occurs
---
*🧠 Smart Money View:*
- Likely a *liquidity sweep* below wick zone.
- Demand zone got respected → smart money possibly reloading longs.
- If next candle closes bullish, more confirmation for continuation.
USATEC trade ideas
NAS100 High-Risk Momentum Play with Potential H&S SetupNAS100 is hovering near all-time highs. While a retest of the weekly trendline remains likely, this idea aims to ride the current bullish momentum. The plan anticipates a short-term pullback to recent lows to potentially form a head and shoulders pattern before a move lower toward the weekly trendline. This is a high-risk setup I’d typically avoid, but the strong bullish weekly close adds some weight. Two entries provided - one with a tighter TP for a quicker reaction.

Pullback before next leg up
NASDAQ’s looking weak short term. We’ve seen multiple rejections from the highs, an M pattern forming on the daily, and RSI divergence creeping in on the daily — momentum is clearly fading. I already took profit around 21980. And a few small swings between the range since 3rd of June.
The rally off the tariff drop was sharp, but it feels mechanical. Bulls look tired here. You can see price is stalling — pushing into the same highs but getting nowhere. Classic signs of distribution.
That said, this isn’t the start of a full-blown bear market. The long-term trend remains bullish. AI investment is still piling into the U.S., tech’s still leading globally, and structurally we haven’t broken down yet. Some weakness is starting to show though.
But short term, I think we see a pullback. The Fed’s still sitting on the fence with rate cuts, which is creating uncertainty. Add that to the current geopolitical tensions, and there’s enough on the table to justify a temporary risk-off move.
If price breaks and closes above 21,860, I’ll reassess and potentially shift back to a bullish bias. Until then, I’m leaning short and letting price action do the talking.
My key downside levels:
TP1: 21,483 — scale out and protect.
TP2: 21,322 — potential bounce from this area.
TP3: 21,145 — structure starts to weaken.
TP4: 20,894 — bears starting to control and a deeper flush, I’ll reassess bias at this level.
SL @ 21850 on my second entry short
Short term: pullback likely.
Big picture: still bullish — but bulls need to reset before any next leg up.
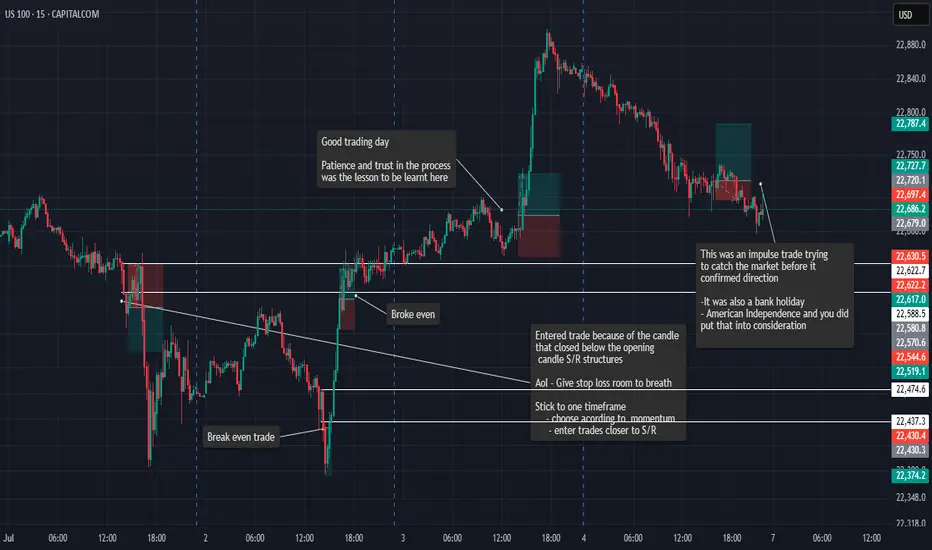
Last Weeks Trades and AnalysisWeek 1 - Trade reviews
This is a look back at the trades i tooks and the lessons taken from that day, More information is in my trading journal
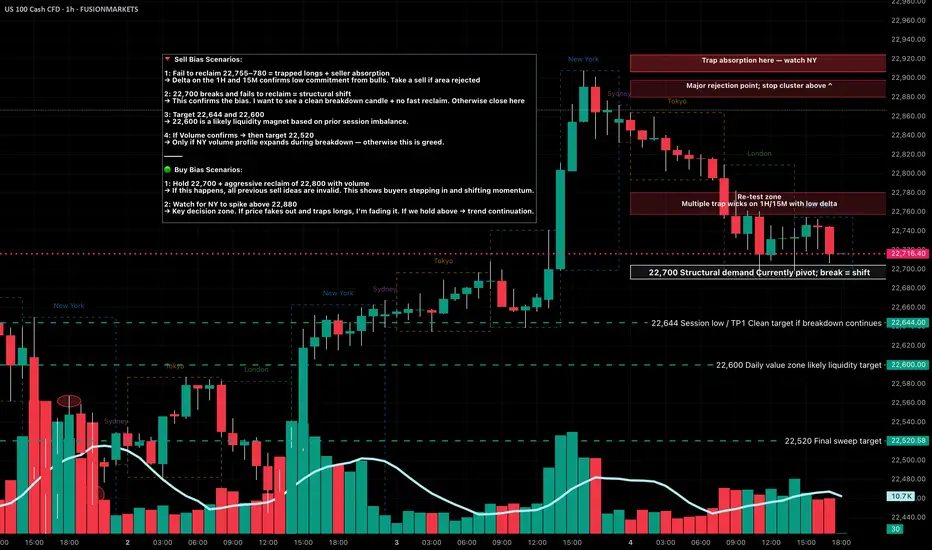
NASDAQ Key Levels July 7 2025If NY fails to reclaim 22,755–780 early in the week, expect a grind back toward 22,644 → 22,600, with 22,520 in play only if volume confirms. Reclaiming and holding above 22,800+ would invalidate this bearish setup.
Watch for trap volume, delta reversals, and volume imbalances at all key zones before entering.
22,880 – 🔻 Weekly wick top
➤ Major rejection zone with a stop cluster sitting above.
22,800–820 – Possible NY trap zone
➤ Trap absorption detected here on footprint — watch New York for rejection or breakout.
22,755–22,780 – Retest zone
➤ Multiple trap wicks with low delta on 1H/15M. Likely to bait breakout traders before fading.
22,700 – Structural demand / pivot point
➤ A clean break + hold below = bearish market shift.
22,644 – ✅ Session low / Take Profit 1
➤ If 22,700 breaks, this is the first clean downside target.
22,600 – Daily value zone
➤ High-probability liquidity target if selling extends below 22,644.
22,520 – Final sweep target
➤ Only likely if New York session sells off hard mid-to-late week.
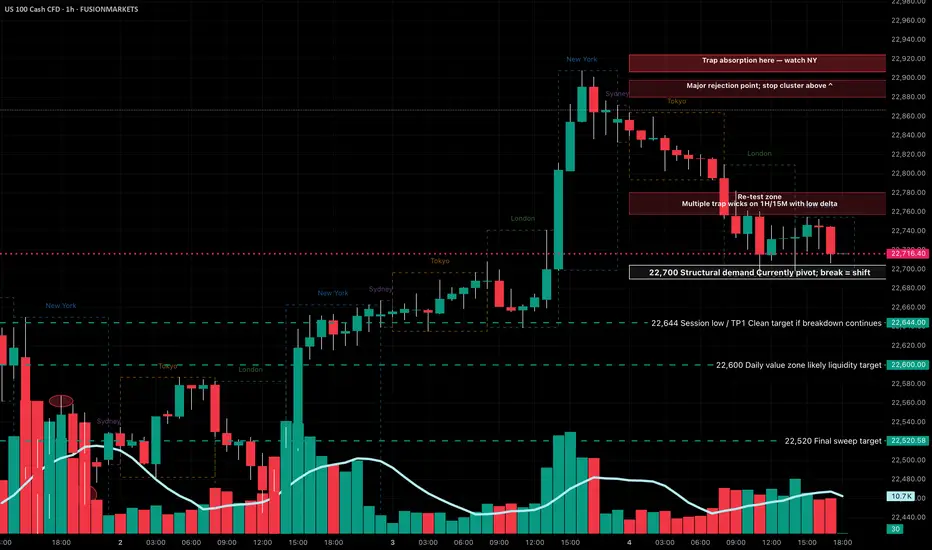
NASDAQ Key Levels July 7 2025If NY fails to reclaim 22,755–780 early in the week, expect a grind back toward 22,644 → 22,600, with 22,520 in play only if volume confirms. Reclaiming and holding above 22,800+ would invalidate this bearish setup.
Watch for trap volume, delta reversals, and volume imbalances at all key zones before entering.
22,880 – 🔻 Weekly wick top
➤ Major rejection zone with a stop cluster sitting above.
22,800–820 – 🧱 Possible NY trap zone
➤ Trap absorption detected here on footprint — watch New York for rejection or breakout.
22,755–22,780 – 🔁 Retest zone
➤ Multiple trap wicks with low delta on 1H/15M. Likely to bait breakout traders before fading.
22,700 – ⚠️ Structural demand / pivot point
➤ A clean break + hold below = bearish market shift.
22,644 – ✅ Session low / Take Profit 1
➤ If 22,700 breaks, this is the first clean downside target.
22,600 – 🎯 Daily value zone
➤ High-probability liquidity target if selling extends below 22,644.
22,520 – 🧨 Final sweep target
➤ Only likely if New York session sells off hard mid-to-late week.
NAS100 CAUTION - Realistic Perspective!!Dear Friends in Trading,
How I see it,
This rising channel represents severe overbought greed territory.
A very big correction might be around the corner or in the near future.
Daily and Weekly RSI Divergence could be forced to re-balance at any time.
Keynote:
This is not a contradiction of my previous NASDAQ post.
Short-Term strong bullish price action can still prevail.
But please keep this big picture in mind from here on end.
Feel free to ask questions if anything is unclear.
I sincerely hope my point of view offers a valued insight.
Thank you for taking the time to study my analysis.

US100 SELLERS WILL DOMINATE THE MARKET|SHORT
US100 SIGNAL
Trade Direction: short
Entry Level: 22,684.7
Target Level: 22,082.0
Stop Loss: 23,085.2
RISK PROFILE
Risk level: medium
Suggested risk: 1%
Timeframe: 10h
Disclosure: I am part of Trade Nation's Influencer program and receive a monthly fee for using their TradingView charts in my analysis.
✅LIKE AND COMMENT MY IDEAS✅

Upward momentum of Nasdaq continues.Upward momentum of Nasdaq continues. Geo-political Tensions cooling down.

NASDAQ | - Structure Refined | Bullish Intent Into Next WeekPair: NAS100
Bias: Bullish
Timeframes: 4H, 2H, LTFs
• 4H broke structure to the upside with a new HH — clear sign of bullish intent stepping in.
• 2H gives clarity on the move — beginning of the week was messy, but price cleaned up nicely and gave us refined structure to work with.
• Now we wait for mitigation into the OB zone to see if price respects and gives us the setup.
🔹 Entry: After price mitigates OB and confirms with CHoCH on LTFs
🔹 Entry Zone: Marked OB zone — wait for confirmation
🔹 Target: Near structure highs — continuation if bulls step in
Mindset: Messy beginnings don’t mean bad outcomes. Structure eventually reveals the truth — just stay patient and ready.
Bless Trading!

Nasdaq Approaches 23,000 Mark for the First TimeOver the past five trading sessions, the U.S. Nasdaq index has posted a gain of more than 1.5%, supported by a recent rise in market confidence that has pushed the equity index to new all-time highs. The NFP employment data released yesterday surprised markets with 147,000 new jobs, compared to the 111,000 expected, reflecting a recovery in the labor market that could ultimately support domestic consumption in the U.S.. This has helped maintain investor confidence in equities, supporting a bullish bias in the Nasdaq in recent sessions.
Sustained Uptrend
Since the early days of April, the Nasdaq has maintained a solid upward trend, with no relevant signs of selling pressure that would threaten the current bullish structure. As a result, the long-term bias remains clearly bullish within the broader market outlook. However, it's worth noting that a growing sense of indecision has emerged in recent sessions, reflected in the candlestick patterns, which could open the door to short-term bearish corrections.
Technical Indicators
MACD: The MACD histogram continues to hover around the neutral zero line, indicating a balance in moving average strength during recent sessions. If this pattern continues, it may result in a more defined period of price neutrality in the short term.
RSI: The presence of consistent RSI highs, alongside higher price highs in the Nasdaq, has led to the formation of a bearish divergence. This suggests that market equilibrium has been affected by recent bullish momentum, and could lead to price pullbacks in the upcoming sessions.
Key Levels to Watch:
23,000 – Psychological barrier: A tentative resistance level in the short term due to the lack of clear technical references. A breakout above this level could reinforce the current bullish bias and signal a more sustained upward trend.
21,800 – Nearby support: An area aligned with a recent neutral technical zone, which may act as relevant support in the event of a short-term pullback.
21,000 – Key support: A level that coincides with the 50-period simple moving average. A break below this level could put the current bullish structure at risk and pave the way for a more significant downward move.
Written by Julian Pineda, CFA – Market Analyst

NASDAQ 100 TRADING PLAN
⸻
🧠 US100 Multi-Timeframe Playbook
(W1 → D1 → H4 → M30 → M5)
⸻
🔹 Higher Timeframe Context
WEEKLY (Strong Uptrend):
• Key Levels:
– ATH supply: 22,800–23,000
– Support shelf (prior resistance): 22,100–22,200
– 50-SMA: 20,400
– 200-SMA: 16,100
• Summary: Bullish structure is intact as long as price holds above 22,100–22,200 and the long-term trendline.
DAILY (Bullish but stretched):
• Key Levels:
– Upper Bollinger Band: 23,025
– Mid-band & 20-SMA: 22,430
– 50-SMA: 21,985
• Summary: RSI at 66 and MACD > 0 but flattening. This suggests bullish momentum may be cooling — odds of a pause or pullback rising.
4-HOUR (Wedge – Late-Trend Exhaustion Risk):
• Key Levels:
– Rising wedge: upper rail ≈ 23,200, lower ≈ 22,450
– 8-EMA: 22,655 | 21-EMA: 22,425
– Anchored VWAP (from June low): 22,350
• Summary: Ribbon still bullish, but volume and MACD momentum are plateauing. A break below 22,450/VWAP confirms a corrective leg.
30-MINUTE (Neutral to Weak):
• Key Levels:
– Descending micro-trendline: 22,725
– Rising support: 22,690
– Session range: High = 22,845 | Low = 22,690
• Summary: Price is coiled near the apex. EMAs curling downward. Market decision point imminent.
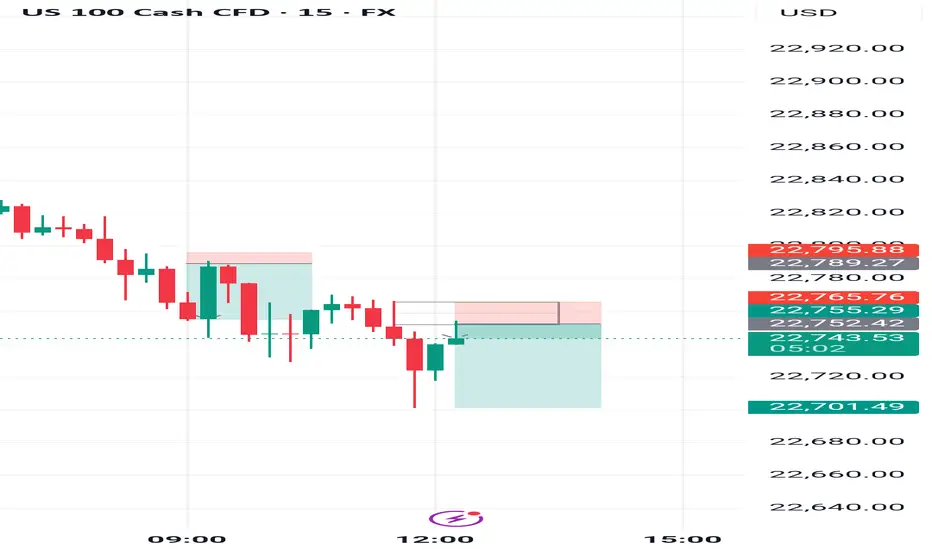
5-MINUTE (Immediate Bear Bias):
• Key Levels:
– Live VWAP: 22,752
– 9-EMA sloping down
– Stochastic: mid-range
• Summary: Price remains below VWAP and 9-EMA. Short-term sellers in control unless VWAP is reclaimed.
⸻
📈 Trade Setups
1. Swing Long – Buy the Dip
• Let price wash through 22,450–22,350 (H4 wedge floor + VWAP zone)
• Enter if:
– 30m bullish engulfing or hammer closes back above 22,450
– AND 5m VWAP is reclaimed
• Initial Stop: Below liquidity sweep or 22,300 – whichever is lower – minus 0.25 × ATR(14, H4) ≈ 30 pts → around 22,270
• Targets:
– T1: 22,845
– T2: 23,200
– Leave runner for blue-sky continuation
• Comment: With weekly trend. Wait for deep retracement. Great RR ≈ 1:3+
⸻
2. Intraday Short – Mean Reversion
• Trigger Zone: 22,725–22,760 (broken trendline + 5m VWAP)
• Enter if:
– 5m rejection wick or bearish engulfing forms on avg+ volume
• Stop: Above 22,800 + buffer (≈ 22,820)
• Targets:
– T1: 22,600
– T2: 22,450
– Optional T3: 22,350 (VWAP)
• Comment: Counter-trend, so treat as scalp. Tight stops. Demand at least 1:2 RR.
⸻
3. Breakout Long – Trend Continuation
• Entry Criteria:
– 30m close above 22,845 with 150%+ average volume
– 5m bull flag holds above breakout level
• Stop:
– First 30m candle close back inside the range
– Or 22,770 (flag base) — whichever happens first
• Targets:
– T1: 23,025 (Daily BB)
– T2: 23,300 (measured move)
• Comment: Only take if strong volume confirms new participation. Avoid during Asia or illiquid hours.
⸻
⚙️ Execution & Risk Guidelines
• Risk per trade: ≤ 1% account (limit counter-trend trades to 0.5%)
• Sizing formula:
Contracts = Account Risk / (Stop pts × $ per pt)
• ATR reference:
– ATR(14, H4) ≈ 120 pts
– ATR(14, 30m) ≈ 80 pts
• Move stop to break-even once price moves 0.75 × stop distance in your favor
• Never run trades #2 and #3 at the same time → directional conflict
• Watch out for macro data (e.g., NFP, CPI) — can override intraday structure
⸻
⏱ What to Watch (In Sequence)
1. Overnight – Does price stay pinned below the 30m 21-EMA, or start to float above it?
2. London Open – First test of the 22,725–22,760 zone: fade or reclaim?
3. NY Open – Volume surge confirms either breakout (#3) or fade setup (#2)
4. End of Day – A close below 22,450 on volume = deeper pullback risk toward 22,000 next week
⸻
🔍 Final Thoughts
The trend is still your friend — but the daily and H4 chart are stretched. Let the trade come to you:
• Buy the flush only if we dip into confluence support and reclaim key levels (#1)
• Buy the breakout only if high volume confirms continuation (#3)
• Everything in-between is a scalp fade (#2) — execute cleanly, with defined risk, and respect trend structure.
This is for educational purposes. Fit these into your system and risk tolerance.
⸻

US100 MARKET OUTLOOK - H1Price is strongly bullish in monthly, weekly and daily but we’re currently seeing a retrace in H1 timeframe. we’re going to see price tap into our H1 point of interest .

US100 — New ATH Trading SetupThe price recently previous ATH at the 22730 level. Current ATH is marked near 22,800, with a POC at 22,640.
Potential support around 22,500, below POC.
Watch for a bounce or further rise beyond 22,920.
Buyers probably will push right through 23,000 level today on Micros and Minis.

Discount Zone Reversal Play Entered a long position after identifying an short formed W formation within discount territory, mapped from yesterday’s high–low range. Price action showed clear structural symmetry, with the second leg completing at a key demand zone.
📌 Buyside liquidity at 22,692.27 acted as the inducement level—price swept it and respected the zone, signaling smart money accumulation.
Key Confluences:
- Extended W structure with balanced legs and volume support
- Price operating below EQ before trigger, favoring bullish reversal
- TP placed just above EQ to anticipate reaction without overextending
- Structure confirmed by neckline retest and bullish candle ignition
This setup aligns with a classic liquidity sweep and reversal narrative, targeting measured premium zones while managing drawdown with tight risk control. The trade is guided by structure, liquidity, and session timing—a patient play with clean narrative flow.

USNAS100 Key Level: 22,740 – Will the Trend Continue or Reverse?USNAS100 Update – Bullish Momentum Holds Above 22,740
USNAS100 has continued to push higher, following through as expected from yesterday’s analysis.
The index maintains bullish momentum as long as it trades above the key pivot at 22,740.
However, a 1H close below 22,730 could trigger a bearish correction toward 22,615.
A sustained break below that level may shift the trend to bearish.
Key Levels:
• Resistance: 22,870 / 23,000
• Support: 22,615 / 22,410

NAS100 UPDATE - Potential Targets Dear Friends in Trading,
How I see it,
Key Support / Pivot @ 22665.00
If key support holds, bullish rally can potentially remain intact
A strong breach below 22605.00, can potentially force
price back to original demand.
I sincerely hope my point of view offers a valued insight.
Thank you for taking the time to study my analysis.

USTEC 15M Trade Setup Analysis (TCB Strategy)📊 USTEC 15M Trade Setup Analysis (TCB Strategy)
Trade Type: Countertrend Breakout -> Continuation
Symbol: USTEC (NASDAQ 100 Index)
Timeframe: 15-Minute
Entry Zone: Around 22,500
Resistance Zone: 22,587.90
Target: 22,865.84
Stop Loss: 22,458.87
Risk–Reward: 1:3 (approx)
Structure: Falling wedge breakout into bullish channel
Setup Confidence Score: 95%
📝 Analyst Notes
Price is breaking out from a well-defined falling wedge within a rising channel. Entry around 22,500 is based on breakout momentum, with SL tucked under structure. A retest entry would offer added confluence. Resistance at 22,587.90 is critical—a break and hold above confirms bullish strength toward the 22,865 target.
🎯 Execution Plan
Option 1: Aggressive entry near 22,500–22,540 (early breakout)
Option 2: Wait for clean retest of wedge breakout or 22,500 zone
Target: 22,865 (upper channel boundary)
SL: 22,458 or below the recent structure low
R:R: ~1:3 — very favorable
🟢 Verdict
This is a high-quality TCB setup, especially if we get a retest confirmation. The bounce off channel support + wedge breakout = excellent confluence.

Nasdaq-100 H4 | Bullish uptrend to extend higher?The Nasdaq-100 (NAS100) is falling towards a swing-low support and could potentially bounce off this level to climb higher.
Buy entry is at 22,509.40 which is a swing-low support that aligns closely with the 23.6% Fibonacci retracement.
Stop loss is at 22,150.00 which is a level that lies underneath an overlap support and the 38.2% Fibonacci retracement.
Take profit is at 23,264.68 which is a resistance that aligns with the 61.8% Fibonacci projection.
High Risk Investment Warning
Trading Forex/CFDs on margin carries a high level of risk and may not be suitable for all investors. Leverage can work against you.
Stratos Markets Limited (tradu.com ):
CFDs are complex instruments and come with a high risk of losing money rapidly due to leverage. 63% of retail investor accounts lose money when trading CFDs with this provider. You should consider whether you understand how CFDs work and whether you can afford to take the high risk of losing your money.
Stratos Europe Ltd (tradu.com ):
CFDs are complex instruments and come with a high risk of losing money rapidly due to leverage. 63% of retail investor accounts lose money when trading CFDs with this provider. You should consider whether you understand how CFDs work and whether you can afford to take the high risk of losing your money.
Stratos Global LLC (tradu.com ):
Losses can exceed deposits.
Please be advised that the information presented on TradingView is provided to Tradu (‘Company’, ‘we’) by a third-party provider (‘TFA Global Pte Ltd’). Please be reminded that you are solely responsible for the trading decisions on your account. There is a very high degree of risk involved in trading. Any information and/or content is intended entirely for research, educational and informational purposes only and does not constitute investment or consultation advice or investment strategy. The information is not tailored to the investment needs of any specific person and therefore does not involve a consideration of any of the investment objectives, financial situation or needs of any viewer that may receive it. Kindly also note that past performance is not a reliable indicator of future results. Actual results may differ materially from those anticipated in forward-looking or past performance statements. We assume no liability as to the accuracy or completeness of any of the information and/or content provided herein and the Company cannot be held responsible for any omission, mistake nor for any loss or damage including without limitation to any loss of profit which may arise from reliance on any information supplied by TFA Global Pte Ltd.
The speaker(s) is neither an employee, agent nor representative of Tradu and is therefore acting independently. The opinions given are their own, constitute general market commentary, and do not constitute the opinion or advice of Tradu or any form of personal or investment advice. Tradu neither endorses nor guarantees offerings of third-party speakers, nor is Tradu responsible for the content, veracity or opinions of third-party speakers, presenters or participants.

LONG NASDAQ50% Monthly candle breakout
50% Weekly ob
50% Candle weekly
Fibonacci retracement to golden ratio 61.8 TO 79%
Break out of a London high .


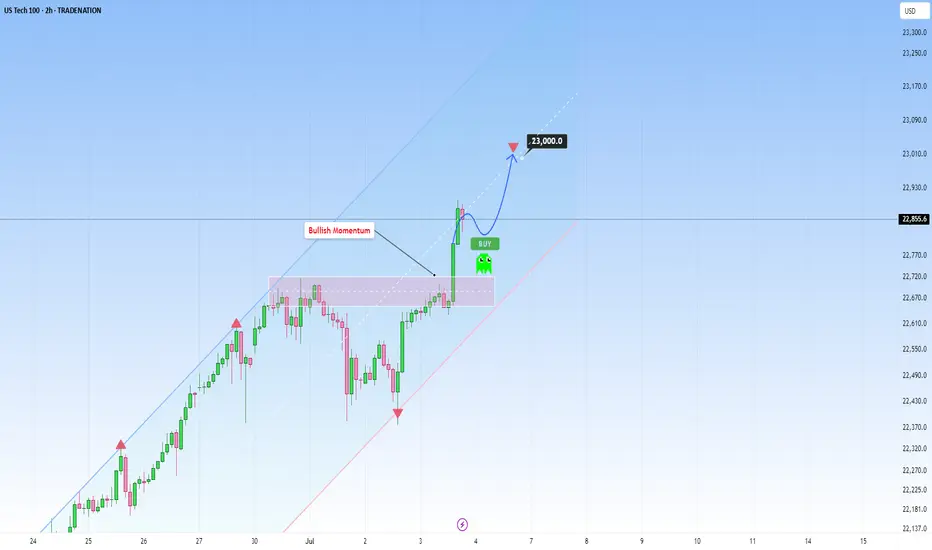
US100 rises sharply, with further upside target of 23,000At this stage, US100 continues to ride a dominant ascending channel structure, maintaining a consistent bullish structure supported by strong fundamentals as well as technical positioning.
The current price action reflects a high-confidence trend environment, underpinned by steady economic resilience in the U.S. tech sector and growing investor optimism surrounding AI-driven growth and corporate earnings. This alignment between structure and sentiment reinforces the strength of the current trend.
What’s especially encouraging is how the price has remained in the upper half of the ascending channel. Every corrective move has been shallow and absorbed quickly as well. This kind of behavior is exactly what you want to see in a strong trend.
From a structural perspective, the recent break of the prior swing high confirmed a bullish break of structure (BOS), reinforcing the broader uptrend. That’s a meaningful move, not just technically, but also psychologically, as it validates that bullish momentum remains intact and market participants are still positioning for higher levels.
No signs of weakness are showing up yet. If anything, the structure is intact and there’s no evidence of a shift in momentum. This makes it a good opportunity for traders who are "late to the party" to consider entering, as the trend still looks strong and continuation is likely.
As for upside targets, the 23,000 level is a natural extension. It aligns with the middle of the channel and fits within the current rate of expansion. If we don’t see any warning signs (like impulsive bearish candles), this target remains both technically justified and psychologically relevant.
Just sharing my thoughts on support and resistance, this isn’t financial advice. Always confirm your setups and manage your risk properly.
Disclosure: I am part of Trade Nation's Influencer program and receive a monthly fee for using their TradingView charts in my analysis.