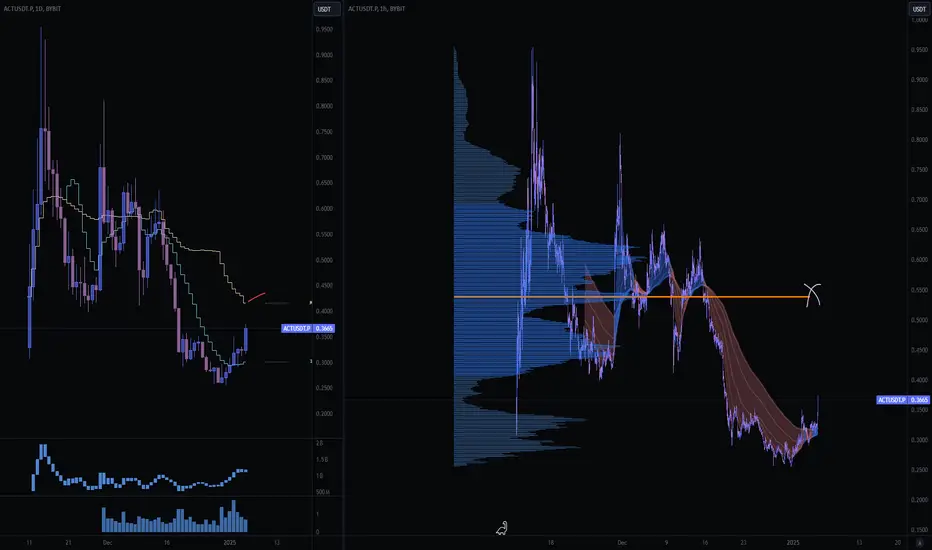
$ACT/USDT AnalysisNASDAQ:ACT is getting rejected from the red resistance zone.
🎯 Options to consider:
1️⃣ Option 1: If the price breaks out of the red resistance zone, the targets are:
First Target: Green line level
Second Target: Blue line level
2️⃣ Option 2: If the price pulls back to the green support level, it could present a potential long entry.
ACTUSDT trade ideas

ACT Coin NEXT POSSIBLE MOVES AND TRADE SETUPS !!NASDAQ:ACT Coin Update & Next Possible Moves!!
• Right now NASDAQ:ACT Coin price trading in a falling wedge on 1D Tf & overall structure look bearish.
• but once its break its resistance trendline then minimum 30% bounce back expected.
• Let's see what happened.
Warning : That's just my analysis DYOR Before taking ant action🚨

Trading opportunity for ACTUSDTBased on technical factors there is a Sell position in :
📊 ACTUSDT
🔴 Sell Now
🪫Stop loss 0.238000
🔋Target 0.114000
📏 R/R 2
💸RISK : 1%
We hope it is profitable for you ❤️
Please support our activity with your likes👍 and comments📝

$ACT - Long SetupAltcoins have been down so bad from their highs, but I'm still expecting high volatility this week.
Just taking this one with a tight stoploss just below 0.15 (low)
Long at current market price (cmp) , dca level at 0.165
Targets:
tp1 - 0.20
tp2 - 0.25
tp3 - 0.32

#ACT supports OB for long position.I'll try long if #ACT supports OB. 3.43% stop-loss, 10X for 34,3% gain.
#ACT LONG
ENTRY - 0.24136 - 0.22916
STOPLOSS - 0.22672
TP1 - 0.35097
TP2 - 0.44986
TP3 - 0.55040
TP4 - 0.64430
TP5 - 0.79471
R:R - 44.57

Trading opportunity for ACTUSDTBased on technical factors there is a Buy position in :
📊 ACTUSDT
🔵 Buy Now
🪫Stop loss 0.243000
🔋Target 0.287000
📏 R/R 2
💸RISK : 1%
We hope it is profitable for you ❤️
Please support our activity with your likes👍 and comments📝

Act/UsdtBINANCE:ACTUSDT
📉 **ACT price analysis**:
- The current price is **0.2591**, which is holding at the previous resistance level. If it stays here, the price could try to move higher to these resistance levels:
1. 🔝 **0.2843**
2. 🔝 **0.300**
3. 🔝 **0.3454**
4. 🔝 **0.400**
- If the price **doesn’t** hold here and starts dropping, it might find support at the following levels:
1. ⬇️ **0.2445**
2. ⬇️ **0.2143**
---
🚨 **Disclaimer**: This is not financial advice. Always do your own research before making any trading decisions! 😊

$ACT - Buying ZonePrice has reached the 1.318 fibonacci level from the highs.
We can scale into long at 0.27s to 0.24s range, though we might deviate to .24s to sweep the lows so leave something for DCA.
0.29 seems to be the immediate resistance, mapping out the levels for potential targets.
Potential Targets:
tp1 - 0.32
tp2 - 0.36
tp3 - 0.42 (swing point)

ACTUSDT: surge and deception before the fall ACTUSDT is testing trend resistance with a sudden impulse. The downtrend may stop such a strong growth on the background of calm bitcoin which draws a small correction
Consolidation of the price below the downtrend line after a false breakout will be a good signal for further decline.

ACTUSDT 12HACT ~ 12H
#ACT If you still have Conviction on the coin,. This support block would be a very good buying place for now.

ACT/USDT Descending Channel Breakout The chart highlights a bullish Descending Channel pattern, signaling a potential upward breakout. The price is consolidating near the upper boundary of the channel, suggesting strong momentum buildup. A 4-hour candle close above the trendline would confirm the breakout, triggering a potential rally.
Key Observations
A well-defined descending channel indicates a bullish reversal setup.
The current price near $0.43 is poised for a breakout with strong momentum.
Target for the move lies at $0.60, aligning with prior resistance levels.
Strategic Implications
Wait for a confirmed 4-hour candle close above the upper trendline for long entries. A retest near the $0.40 support zone could offer a favorable risk-reward entry. Utilize proper stop-loss levels to mitigate risks and avoid false breakouts.

ACTUSDT UPDATEACTUSDT is a cryptocurrency trading at $0.4312. Its target price is $0.8000, indicating a potential 100%+ gain. The pattern is a Falling Wedge, which is a reversal pattern. This suggests that the downward trend may be coming to an end. A breakout from the Falling Wedge could lead to a strong upward move. The current price may be a buying opportunity. Investors are optimistic about ACTUSDT's future performance. Reaching the target price would result in significant returns. The Falling Wedge pattern is a bullish signal, indicating a potential trend reversal. This could be a lucrative investment opportunity.

ACT - LONG - Good opportunityACT is now ready to give us a chance. Despite being a little late it is still in a good place for daily timeframe. This is a moderate risk trade, as we have a small confirmation and good support. These currencies are also very volatile and high leverage should not be used.
TP 1: 0.42
TP 2: 0.58
TP 3: 0.63 (It's not very likely, but it could be).
SL 1: 0.2368
SL 2: 0.21
-
First trade of 2025, have a happy new year.

DON'T BUY AND REGRET Nothing. I' not convincing you to buy but if you want to make profit. Then listen BUY. Why can't I post with a brief description? lol sadasf sfdgd afsds sdgd dsgdg

Rally loadingPrice currently sitting at a confluence of horizontal resistance, diagonal resistance, 200EMA. Breakout above the confluence,rally to the upside,🚀🚀 Breakdown of structure price will retrace to the downside.

ACTUSDT (ACT I) Updated till 05-01-25ACTUSDT (ACT I) Daily timeframe range. PA is fairly new here if it can stay above 0.2530 it got huge chances of good trades. there is fundamental support too. for now if PA can break 0.4169 clean than it can push toward 0.6714 or above.

$ACT - Scalp Long SetupACT is showing signs of recovery and gaining traction, suggesting it might be ready for another upward move.
ACT has shown signs of potential growth, having deviated slightly on its previous low at .40
If we can hold .35 support, we can potentially retest this previous low.
Long Entry: at cmp .36 to .34
Stop below .30
Potential Long targets:
.40-.42 (m_evwap)
.50-.54 (npoc/hvn)
.60-.64 (w_vwap)
According to the AI Agent trend, ACT will keep expanding.Retesting the closest supply and demand zone, it appears that the bottoming process BINANCE:ACTUSDT at $0.26 has been finished with a breakout to $0.35. For purchase orders, this backtest of the $0.3 support is perfect.
The $0.45 zone, the first consolidation zone and the most significant level, will be the closest target. Following that, we may keep distributing at $0.53 and particularly at $0.63, where there are a lot of strong reactions that point to significant selling.

Long Singal on ACTUSDT 2 JANUARY 2025Long signal appeared after breaking the EMA line and showing sign of trend reversal to long after declining below the 0.3$.

Analysis for ACT/USDT ChartThe price is currently consolidating near the Buy Zone, with a descending trendline acting as resistance. A potential breakout above this trendline could trigger bullish momentum, targeting higher levels.
Key levels to watch:
Buy Zone: Ideal entry point.
Breakout confirmation: Above the descending trendline for a bullish continuation.
Target: $1.00+ if momentum sustains.
Maintain risk management as this setup depends on breakout confirmation! 🚀

Act/UsdtBINANCE:ACTUSDT
### 📈 **Price Trend**
- The price is currently **pushing upwards** 📈. It’s trying to break through certain **resistance levels**. If it continues moving upwards and successfully holds, it could reach higher price points.
---
### 🔴 **Resistance Levels (Where Price May Face Difficulty Going Higher)**
1. **0.300** 🚫:
This is the first **resistance level**, meaning the price could face difficulty breaking through here. If the price reaches this point, sellers might step in, pushing the price back down.
2. **0.3480** 🚫:
The next key resistance level. If the price manages to break above 0.300, it could face further challenges at 0.3480. This is another level where the price might stall or reverse.
3. **0.4016** 🚫:
The **highest resistance** in this scenario. If the price breaks both 0.300 and 0.3480, 0.4016 would be the next significant level to watch. Reaching this level would suggest strong upward momentum, but also increase the chances of a pullback due to selling pressure.
---
### 🟢 **Support Level (Where Price Has a Strong Base)**
- **0.2400** 🔑:
This is the **support level**, which is where buyers are likely to step in and prevent the price from dropping further. If the price falls to this level, it’s expected to find buying interest and potentially bounce back up. It’s an area of price stability, and as long as it holds above this level, the upward trend could continue.
---
### ⚠️ **Important Note (Not Financial Advice)**
- This information is for educational and illustrative purposes only. It’s important to conduct your own research or consult a financial advisor before making any decisions based on price levels and trends. Every market can be unpredictable!

ACT COIN PRICE ANALYSIS AND NEXT POSSIBLE MOVES!!NASDAQ:ACT Coin!!
• 2 major areas where we can expect now potential bounce back in its price🥷
• On First Support Don't Build trade without SL🚨
Warning : That's just my analysis DYOR Before Taking any trade.

ACT on daily chart In my opinion big rebound from this area triple bottom on daily which is 0.29 is now big support
