ACX/USDTKey Level Zone: 0.1820 - 0.1850
LMT v2.0 detected.
The setup looks promising—price previously trended upward with rising volume and momentum, then retested this zone cleanly. This presents an excellent reward-to-risk opportunity if momentum continues to align.
Introducing LMT (Levels & Momentum Tr

BUY/LONG ACXUSDT FOLLOWING D1 PEAKBUY/LONG ACXUSDT FOLLOWING D1 PEAK
This week, from now until the weekend, BTC is expected to correct. Let BTC do its thing—but its correction benefits pairs like ENA, PNUT, ACX, and others waiting for BUY entries. These pairs will likely reach their entry levels soon, or even dip lower, depending

ACXUSDT – Resistance Zones Marked on the Chart!
“Key levels ahead—will resistance hold or will we see a breakout?”
🔥 Key Insights:
✅ Resistance Zones Clearly Defined – Watch for strong reactions.
✅ Rejection = Short Setup – Only with LTF breakdown + CDV confirmation.
💡 The Smart Plan:
Focus on LTF (15M & 1H) Price Action – Breakout or re

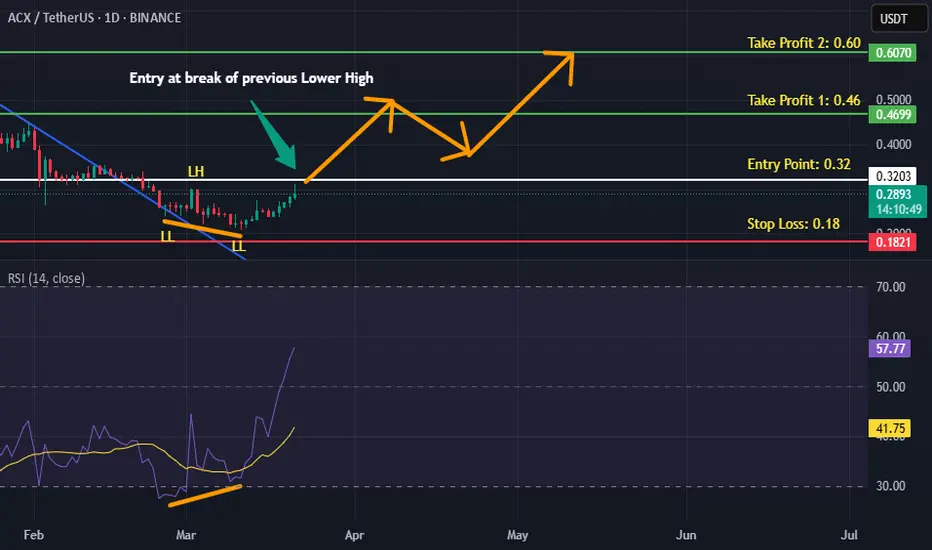
ACXUSDT is BullishPrice was in a downtrend, however it has given a breakout from the descending trendline and bulls seem to be in the driving seat now. If previous lower high is broken with good volume then we can expect a good returns as per Dow theory. Targets are mentioned on the chart.
ACXUSDT CHART ANALYSİS - EDUCATIONAL POSTDiscover what an NFT is and what all the hype is that's surrounding the space.
An NFT, or non-fungible token, is a unique, digital certificate stored on a blockchain. This guarantees the originality of any item, giving the owner exclusive rights to it. Such tokens cannot be discreetly tampered wit

ACXUSDT Trading opportunityACXUSDT has just completed a potential wave 3 move and has entered corrective wave 4. We are monitoring the current price action for a potential buy-back opportunity as wave 4 unfolds, with the possibility of a strong move towards the projected final target of wave 5.
The current demand area prese

ACX/USDT potential symmetrical triangle breakout💡 The price is consolidating beautifully, and the breakout near point D shows promising bullish potential. Stay sharp and manage your risk carefully! 🔐
Let me know your thoughts or if you're riding this setup. 🚤 React 👍 and drop a comment! Let's win together! 💪
#ACXUSDT #CryptoTrading #SpotTrade #

ACXUSDT Analysis: Promising Demand ZonesThe marked blue boxes on the chart represent key demand zones that could provide excellent entry opportunities. These levels are carefully selected using advanced tools and techniques.
Key Highlights:
Demand Zones: The blue boxes are potential reaction areas where buyers may step in.
Marke

ACX COIN PRICE ANALYSIS AND NEXT POSSIBLE MOVES!! BME:ACX Coin Updates!!
• ACX Coin Look Strong as Complare to other Alts...
• Right Now price testing its feb key level... If its get rejected then in next few hours may be we see it price again b/w 0.69$-0.65$ area✅
• if price drop b/w 0.69$-0.65$ area or at 0.57$-0.54$ area then we will try t

ACX - Binance pump - LONGSo ACX is on Binance now. The pump is normal. Everybody right now is taking profit. The 0.90$ is tested from there in current bullrun only up in my opinion. First will be 1.20$ then down then up again. Oppened long position at 0.92$ becasue it cannot fall more, there is no volume below 0.90$ so I be

See all ideas
Summarizing what the indicators are suggesting.
Oscillators
Neutral
SellBuy
Strong sellStrong buy
Strong sellSellNeutralBuyStrong buy
Oscillators
Neutral
SellBuy
Strong sellStrong buy
Strong sellSellNeutralBuyStrong buy
Summary
Neutral
SellBuy
Strong sellStrong buy
Strong sellSellNeutralBuyStrong buy
Summary
Neutral
SellBuy
Strong sellStrong buy
Strong sellSellNeutralBuyStrong buy
Summary
Neutral
SellBuy
Strong sellStrong buy
Strong sellSellNeutralBuyStrong buy
Moving Averages
Neutral
SellBuy
Strong sellStrong buy
Strong sellSellNeutralBuyStrong buy
Moving Averages
Neutral
SellBuy
Strong sellStrong buy
Strong sellSellNeutralBuyStrong buy
Displays a symbol's price movements over previous years to identify recurring trends.