ADA Inside Triangle That Can Rise If Not Break DownTriple BottomADA is inside a triangle that can rise if it does not break down Triple Bottom, and confirmation of the rise will be by penetrating the triangle upward.
ADABEARUSD trade ideas

Breaking The $0.25 Gates, ADA Price Might Descend To $0.20!Cardano (ADA) displays a bearish breakdown of a head and shoulder pattern.
ADA price has dropped below the 25 cents mark.
The daily chart shows ADA under a strong resistance trend line, leading to multiple lower-high formations.
ADA is currently trading at $0.244, with a bearish pattern indicating a potential downtrend to $0.15.
Technical indicators like the RSI show bullish divergence, while the MACD indicates a bearish crossover.
If ADA breaks below the $0.235 support, it could continue its downtrend to $0.20. A bullish reversal from $0.235 could challenge the resistance trend line.

ADA in weekly chart Hi friends
I have spent all of these days to analyze BTC and ETH
and now I am fairly sure that we will see a huge drop
in BTC and ETH and so in other ones following these 2
masters. ADA is included in this forecast and I expect to see its another drop in the next weeks.
I am not sure that which resistance will have the enough
power to reverse the bearish chart and it will be cleared in the next weeks.
Be happy

Cardano to $150?Long term cup and handle formation in play, targeting $150 in next bull run.
Disclaimer: Keep in mind that market predictions are about as reliable as a weather forecast in outer space. Use this analysis as a conversation starter, not as financial advice. Investing in cryptocurrencies carries risks, so do your homework and make informed decisions. Remember, no crystal balls here—just a pinch of insight and a dash of caution


CARDANO - Lower Timeframe Overview On the lower timeframe, we can see that we have 2 entry trendlines in place.
The orange trendline = Risk entry
The red trendline = Safe entry
Trade idea:
- watch for break of either trendline for entry
- once trendline broken, stop loss goes below price
- Targets: 0.38, 0.4, 0.46
Goodluck and as always, trade safe!

CARDANO - Higher Timeframe Overview ✨For Cardano, we are expecting a deep retracement on a higher timeframe. Deep retracements usually take the shape of zigzag patterns (535). We have completed wave A ( 5 waves ) and currently in subwave C of wave B ( 3 waves ). Our misson is to catch subwave C before riding wave C ( 5 waves ).
See our next post for lower timeframe analysis.
Goodluck and as always, trade safe!

ADA LONG AT 0.251ADA is reaching a strong support at 0.251 and the RSI is indicating that we are going down at the moment so if we got down and retrace around that area I hope we will see it rising up at least up to 0.266, leaving us with a descent 5.56 % in profit. If we managed to touch the support we will have a low risk and a beautiful loss to win ratio :-).

ADAUSD Analysis 3Sep2023This analysis sees from the market structure that occurs. After Choch the price returns to bearish and there is a fake out. At present the price has not returned bullish, still in the correction stage. There is a possibility that the price touches the fake out area before continuing bullish. Take long when the price approaches the fake out area.

Cardano(ADA) Long Term Analysis Hello my friends, How are you doing?
It's a new day and I want to talk about Cardano to you.
Actually, I really like this asset. But at this price, it's so dangerous to buy.
I want to show you where is the best place to buy and Hold and what's the Final target.
As you understand it's a big scale about Cardano.
So don't forget to Like 👍, share with your friends 🤝, and then Follow ✌️ me to be able to see my next analysis.
Did you do that? So, let's go.
Here is the full analysis for this pair, let me know in the comment section below if you have any questions. I suggest you keep this pair on your watch list and see if the rules of your strategy are satisfied.
Ladies and gentlemen, let me introduce Cardano and the best zone to buy 😍😍
I want to analyze Cardano in Weekly Time Frame.
Before that, I want to remember It's not financial advice. so, just see and think about it.
I'm just sharing my view and opinion of the chart. Please do your own research.
Everything changed when we lost 0.33 USD in Cardano 🤷🏻♂️🤷🏻♂️🤷🏻♂️
As seen on the chart The price is so close to the first Support zone in 15-17 Cent and I expect the price to react to this support. But it's not the End of the movement. I expect the price to go up and then drop again. because the main correction has not ended.
The Second zone is between 8-9 Cent and it's the best zone to buy and hold Cardan for a long time 🧞♂️
Everybody who buys in this zone will be rich. Because from 0.09 To 10 USD.
It would happen around April 2024.
There is too much distance and I want to tell you and huge profit is coming. I mean it's more than 10000%. Such a wow.
As I told you my final target for Cardano is 10 USD 😍😍
So, don’t miss this chance.
We will enter into the depression zone soon.
Please be patient and put your order carefully.
We will never see this price anymore.
Please like, follow, share, and comment if you enjoy this Idea, Also share your ideas and charts in the comments.
Wish you health and wealth 💶
I hope you will fulfill your ambitions.
Sincerely Yours
Ho3ein.mnD ❤️

Cardano: Hugging the Floor with Zero DemandCardano is on a downward trajectory. If it keeps up the pace, I expect to see the 1.272 Fib level re-mitigated soon. Under this level would be prime bargain-basement level prices to begin a DCA campaign. Or short. Whatever floats your boat. Possible liquidity grab into overbought territory north of the channel trend before the markdown and retest of the lows. Whatever you do, don't buy the top. Strong hands always; wait for the PA to fall back to structure.
Be sure to LIKE and SUBSCRIBE if charts like these are beneficial to you.
Stop getting smashed and start winning in crypto. My charts will teach you how! If you like big wins and big money, be sure to SUBSCRIBE to this channel. Here's why: I track all USD-paired cryptocurrencies on all the major CEXs and seek out the most lucrative swing trades. All my charts are clean and easy-to-follow with exceptional win rates ranging consistently between 80-85%. Check out my chart history and see for yourself.
I've been a full-time cryptocurrency swing trader and investor since 2017. My technical analysis is based on a combination of Wyckoff, VSA, EWT & Fibonacci ratios. I never shill and only chart crypto assets I invest my own money in. My success over the years has allowed me to do this full-time. You are welcome to piggy-back my strategies at your own risk.
**Not a financial advisor. Always DYOR and trade at your own risk.

Will Cardano Find A Bounceback from $0.25?Cardano's market price has fallen to the $0.25 support zone due to a resistance trendline.
ADA price has reached the 25 cents level, diminishing hopes of a bullish reversal.
RSI divergences suggest a potential sharp move in ADA's price.
ADA has returned to the $0.25 level three times in the past two weeks.
Despite a promising 50 EMA breakout, extensive selling at the overhead trendline has kept prices down.
The $0.25 zone has historically been a bounce-back area, with buyers preventing further price decline.
If the downtrend continues below $0.25, the Fibonacci retracement indicates support levels at $0.22 and $0.20.
ADA's current price is $0.256, showing a 1.18% growth for the day.
The market conditions for Cardano in 2023 seem bearish, but the upcoming Bitcoin ETF approval by the SEC could act as a bullish catalyst.
The RSI indicator in the daily chart shows a strong bullish divergence.
A positive trendline breakout could push ADA prices to $0.35 or even $0.45. However, a fall below $0.25 could lead to a significant drop to $0.229.

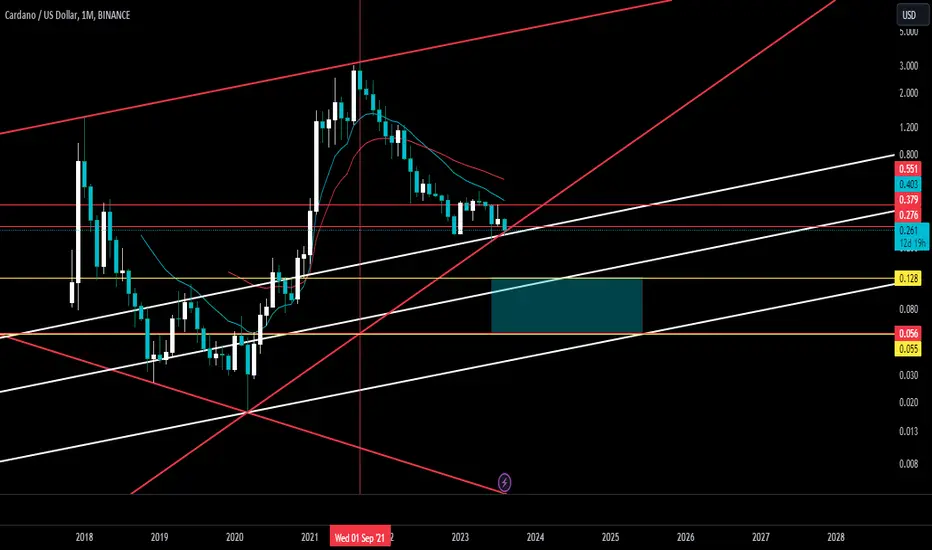
ADA is ready to test 0.25 againADA has recently bounced healthily after the FTX collapse and is now consolidating below a powerful resistance level. This resistance has been significant since it began to form in April 2018 and has acted as both a support and resistance level throughout 2021 and during a descending triangle from May to October 2022. Despite multiple attempts to break through this resistance in the past few days, ADA has been rejected each time, indicating a low probability of breaking through in the near future.
Breaking this resistance will require much more than what ADA has shown in the past two months. It remains to be seen how the day will end, but at the moment, a shooting star reversal candlestick pattern has formed, which is a sign of a potential major reversal and the end of the current bull market.
At this point, it seems that ADA may retest its prior resistance level and may even need to retest its recent low before a new bull market can be established. The overall outlook for ADA appears weak for now, as volume is low and there are no significant signs of buyers that could help break through the resistance. The RSI is in overbought territory, while the MACD is showing some strength.
Also, there is a huge chance for ADA to bounce some more time in this consolidating level before we see some real moves up. Of course, everything will be connected with Bitcoin move. If bitcoin holds its support so will ADA but in case of a failure, ADA will likely retest lows from September 2020 marked with a blue line.
However, if buyers step in and ADA breaks through this resistance level with ease, accompanied by a surge in volume, we could call a bottom for ADA for a long period of time.

Cardano Surge?Cardano back to a major resistance? I’m aiming at $2.1 and then a sell limit back towards $0.1
My Entry: 0.26
SL: 0.11
TP1: 0.35
TP2: 0.37
TP3: 0.44
TP4: 0.46
TP5: 0.53
TP6: 0.63
TP7: 0.7
TP8: 1
TP9: 1.5
TP10: 2.0
TP11: 2.1

ADAUSD (4H) - Bullish reversalHi Traders
ADAUSD (4H Timeframe)
Waiting for the upward break of 0.2728 resistance level, which will complete a bullish trend reversal pattern to go LONG. Only the downward break of 0.2497 would cancel the bullish scenario.
Trade details
Entry: 0.2728
Stop loss: 0.2497
Take profit 1: 0.2871
Take profit 2: 0.3103
Score: 6
Strategy: Bullish reversal

Will Cardano Resurface Above $0.30 or Drop to $0.27?
Break Below Critical $0.30 Support: ADA's price broke this level following a descending triangle downtrend, with a 3.55% fall to $0.299 on August 2nd and a further 2.34% drop.
Bearish Breakout and Retest: The ADA coin price reverses from $0.289 for a retest after a bearish breakout, leading to a 4.12% growth in 48 hours and a new bearish phase.
Evening Star Pattern: This pattern at the retest leads to a 1.90% fall in ADA price, breaking below the 50 EMA in the 4-hour chart, but multiple bullish support levels limit the downfall.
Struggle at Key Levels: The post-retest bearish phase may struggle to continue at support levels of $0.289, $0.280, and $0.270.
Bullish Hope on Daily Chart: A retest of a falling wedge breakout and the support trendline provides a bounce-back opportunity, offering hope for the ADA price trend.
Risk of Prolonged Selling Spree: Selling below the support trendline or $0.29 could crash ADA's market value, testing bullish dominance at $0.280.
Potential Bullish Reversal: A reversal from the support trendline could help ADA resurface above $0.30, possibly driving the price to $0.325 this week.
Crossroads in Multiple Timeframes: The current situation presents a critical juncture for Cardano, with conflicting signals in different timeframes, making it essential for traders to closely monitor support and resistance levels for potential breakout or breakdown scenarios.


Ada BottomLooking At market Structure i have previously monthly be critical support ones it possibly brakes down to target is market.
ADAUSD: Looking to buy again.I am a big fan of Cardano/ADA. I was fortunate enough to get in at the absolute low a couple of years back and ride a spectacular 15-18x wave before getting rid of a big chunk of it. Now at a 90% discount I am buying chunks whenever it is below $0.25. Right now, the probability is to break that floor for one last flush down. I will have some limit orders setup on the trendline and fib level on hope those will hit. I am willing to not set a stop loss on this as I will be holding for a really long time. I am putting back less than half of what I made in the last run (well, after the tax I paid, maybe just putting back the original to add to a still profitable bag), so I can afford sit out the turbulence. I have high hopes this will bear fruit eventually.

ADAUSDT SHORT OUTLOOKHello Traders, this is outlook that i think might be work. All Entry, Stop Loss, and Take Profit its already showed up. All trade it is on yourself. DYOR

ada longwe are looking at a potential situation where ada is ripe for rally, the correction did't went further despite heavy liquidation across other altcoin


Bull Market or One leg Complete CorrectiveWishing you a fruitful week
I would like to share with you two ideas that I have developed using the Elliott Wave Principle.
For more explanation, refer to the attached chart.
Friends, if you like, you can refer to my previous analysis. I must mention that my understanding of the Elliott Wave principle is based on my personal experience, and while I am still learning, I hope to provide better analysis in the future.
Your continued support is greatly appreciated and I look forward to our mutual success.
Sincerely (Mr. Nobody)
Go up and Never Stop.
