ADA on the weeklyThis weekly Cardano chart is looking splendid. Retesting the previous resistance level that has already acted as support in august. As well as drawing a Bullish divergence on the RSI.
ADABTC trade ideas
Cardano Ready to take off ✅✅✅What we see on this crypto pair ADABTC is clear and obviously nice pair for our watchlist, we were following this pair for a while so far, for now our group is ready for nice LONG position.
Just keep it in your mind with proper RISK MANAGEMENT .
MultiTF Analysis
Top down analysis as you see on the different TF, 1W 1D 8H 4H. all areas determined perfectly in higher timeframe and in lower time frame we getting more bullish confirmations, for the last confirmation we waiting 10MA to cross 20MA. but everything else is perfect for this pair to open BUY position.
Dont forget any question comment me bellow
@FxShzd
BEST OF LUCK Everyone

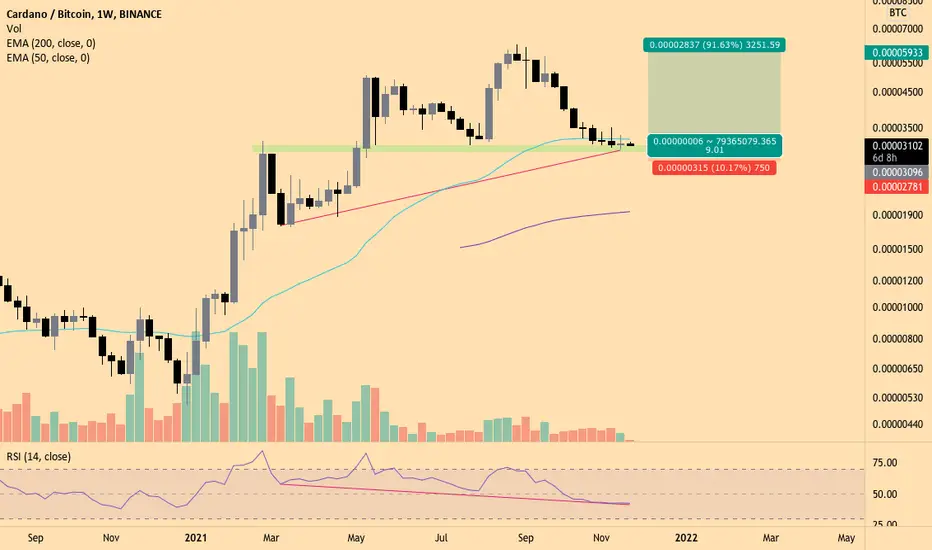
ADABTC Ready for launch20D MA on ADABTC broke from previous support, now acting as local resistance for uptrend. Next consolidation will be with 200D MA (blue line).
Use BTC pairings to triangulate forecasts for USD, if ADABTC is 0.00005 and BTC is flat at $60k, then that first push would get ADA to about $3, 2nd push is where I see ADA moving toward $10.

ADA great buy at these levelsIf we have a crypto blow off how we are expecting the next couple of months ADA is a great candidate for a strong blue chip alt buy. It has a 350% potential vs BTC for the cycle.


ADA/BTC The pair looks extremely promising for long position at the moment! On both weekly and daily charts! ( Big volume, broken RSI channel )
Even though it has already started, there's plenty of distance to the upside!
First target: 200 yellow MA - 0.0000408
Second target: 100 purple MA- 0.0000443
Third target: The Moon!
www.tradingview.com

ADA is about to go up!Hi, price is above the strong support zone and as long as it stays above that zone, we can expect growth.
USE PROPER MONEY MANAGEMENT!

ADA/BTC daily analysiswell, I personally don't like crypto that much, but ADA is looking spicy.
as you can see we made a bottom and its has proved that ADA is not willing to go down any more.
we have an important resistance zone ( red zone ) in front of us and if we make a breakout, we are probably going for a bull rally.
I have marked main resistance zones with red lines, you can use them as TP.
this also applies to ADA/USDT, but I'd like to see coins in their BTC pair because it might give us a chance to prevent market crashes.
Good luck and have great trades
also check out my other analyzes and if you got any ideas, comment below.

Targets and future of ADAif you found this analysis useful please support me with a like/comment
As you see on ADA/BTC chart price nicely reacted to the support. the last time price pumped hard after breaking this level and a new pump is expected. If price rise up to the resistance level on 0.000077 and bitcoin rise up to about 100K then cardano price will be 4.5_5 dollars. If bitcoin hold 70K and ADA/BTC rise up to resistance level then i expect 3_3.5 dollar per cardano

Cardano will most likely form a H&S against BTC by EOYIt sold off too much after it's last run. I think the most likely outcome now is for it to form a lower high. That is, if it runs again at all. With BTC pushing ATHs altcoins across the board could take a major dump against BTC.
I'll be looking to sell the last of my ADA bag on this lower high

ADA/BTC 30x from here. BIG PUMP or a DUMP!Cup and Handle forming. We go 3000% from here for this cycle.
Final Target 1 ADA = 0.00012BTC
144KUSD ATH BTC = 1 ADA will be 17.28
230KUSD ATH BTC= 1 ADA will be 27.6
and so on.
There is no certainty in trading , only probabilities,
and we make sure you are on the right side of the market.
Trade safe.

ADAADA is at a strong support level & looks to have formed a double bottom. Something worth keeping an eye. ADA can really fly once it get going.

ADAUSDTif this two important area breakout we will see the very sharp pump ADA .... i think this will happen soon

ADA/USD potential move to the upside ADA looks like it could be primed for a move to the upside after 2 months of consolidation.
ADA has been moving sideways for quite some time now while many other layer 1 blockchain solutions like DOT, AVAX, LUNA and SOL are making big moves. It could be ADA's time to make its next move higher.
There is RSI hidden bullish divergence forming on the 12hr and 1D, so keep an eye out for a break of the trend line to the upside. It is currently forming a large flag pattern for which I would be setting alerts if the current tend line is broken to upside.
October 27th was significant because it took out recent swing low on September 21st which would have taken out a load of stops. There is support in this region of $1.85-$1.95 region. Also since the move up in July, the current retracement hit exactly 0.618 Fibonacci.
What is furthermore interesting is the ADA/BTC chart which is currently sitting at both strong weekly AND monthly support. You can see we have had strong bounces from the 3000 sats area before. We have had near on 8 week of downside (except for one week) which has resulted in a sharp 50% drop since the highs in August so we could expect a reversal of some magnitude at these levels.
Additionally ADA\ETH is also testing a region of weekly and monthly support from which is has frequently seen 80%-100% bounces from in the past.
I have been trading crypto markets for over 4 years so If you appreciate this post and would like more please like the post and comment below. Happy trading 😎

Support zone for CardanoPlease watch out if this zone broke down price could reach the next red line support level in the chart so if brakes sell at the pullback before falling more.

Cardano Ultrabullish divergenceA bullish divergence in daily chart is a good moment to invest in Cardano.
We need to avoid risk and use a stop loss, but I think this is a really safe entry

ADA/BTC: You won't find any macro as clean as this one.For now BTC is the better play. Later in the year massive upside potential!


$ADA to go on a couple short bull runs into Feb '22? First time sharing a trade but just couldn't help but see how $ADA has been performing YTD. Of course, this is $ADA/$BTC--I prefer $BTC markets myself. Anyway, this is in no way financial advice, just simply speculation of historical patterns. Invest at your own risk! I do have some bias towards Cardano by being a pretty big fan of the project. Anyway, even the RSI is looking insanely low. Also, I drew in an estimated ema cross. Not guaranteed but if it does, it could show a sign of trend reversal. Which looking at $ADA's history, we could see some nice runs.
Best of look everyone out there! Cheers

✅ ADABTC +50% 💥ADABTC is touching a support right now.
Higher Lows on RSI.
It might go sideways in the support zone but probably we will see an upward move from this level.

cardano New High accepted 5 December hi
cardano New High accepted 5 December in btc pair 7000 first second 8000 btc

ADA and the 101 satsCan you imagine this cliff hanger?! ADA must choose here.... it's either the start of an epic run.... or it eats some poo.
This is not investment advice and I'm not claiming a direction. But place your bettttttttzzzzzzzzzzzzz.
But check out that amazing vol spike. Vol spikes like that in the trend can be the sign of a final sale and a reverse. LET'S SEE

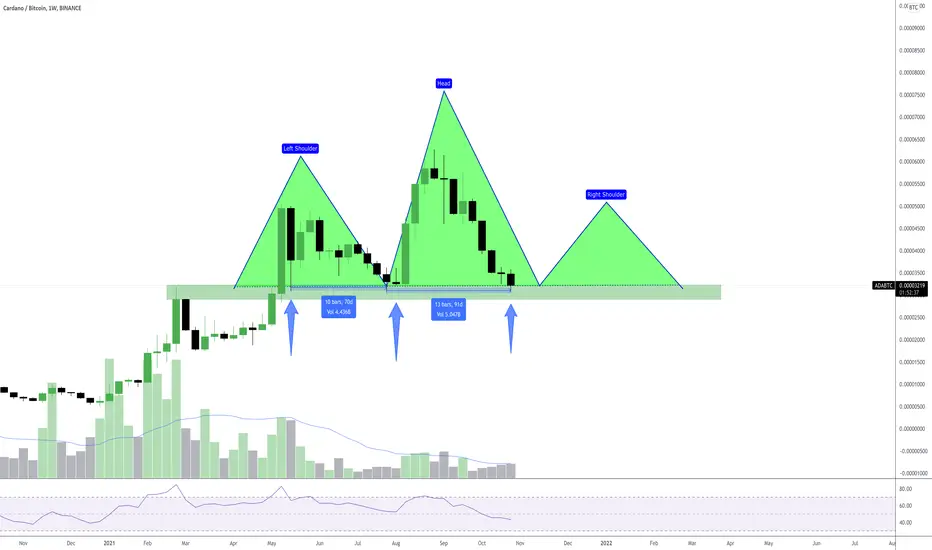
ADABTC - + 50% 🚀I think we will see some bullish action for ADA next couple of days.
We are testing major support and if support can hold we need to look out for a right shoulder of a head and shoulder pattern.
To create this right shoulder we can move up about 50%
Thanks for taking your time to check out my idea 😎😎! Often, my ideas are fast gone from the front page because there are so many ideas on the platform and the algo picks the one with more likes 🤖🤖. I think once I have around 20 likes/idea my idea will be shown in front 🥳🥳. It would be awesome if you could like my idea, (only if you really like it of course) 🤪! I believe that the more we can interact with each other, and share thought about an idea, the more we can learn! 👩🏫🧑🏾🏫👨🏻🏫
Furthermore, I made a challenge for myself, I will add 1 idea for every new follower🦹♀️ So if I have 1 follower each day, I will add 1 idea. If I have 10 followers, I will add 10 🏌️♂️ It’s fun for me and you! More followers = more ideas = powerful community! 💪💪💪 Besides, all the ideas are … FREE 🥳🥳🥳
⚠️⚠️ If you want to know how my previous ideas played out, > push the play button on my previous ideas and check it out 🕵️🕵️
Is there a ticker you want me to look into? Let me know in the comments below ⬇️⬇️⬇️