Is ADA/BTC forming a cup and handle on the monthly chart?Hello, I am wondering if anyone can confirm what I'm seeing is reasonable on this monthly chart of ADA vs BTC. It looks like ADA is finishing a cup and handle. I am learning TA still but these seem like reasonable ranges to take profit. Any advice is appreciated. Thanks
ADABTC trade ideas

ADAThe wonderful projects with distinctive Ecosystem. Charles can extend the market cap easily. Will ADA be "ETH killer"?
Let's see!

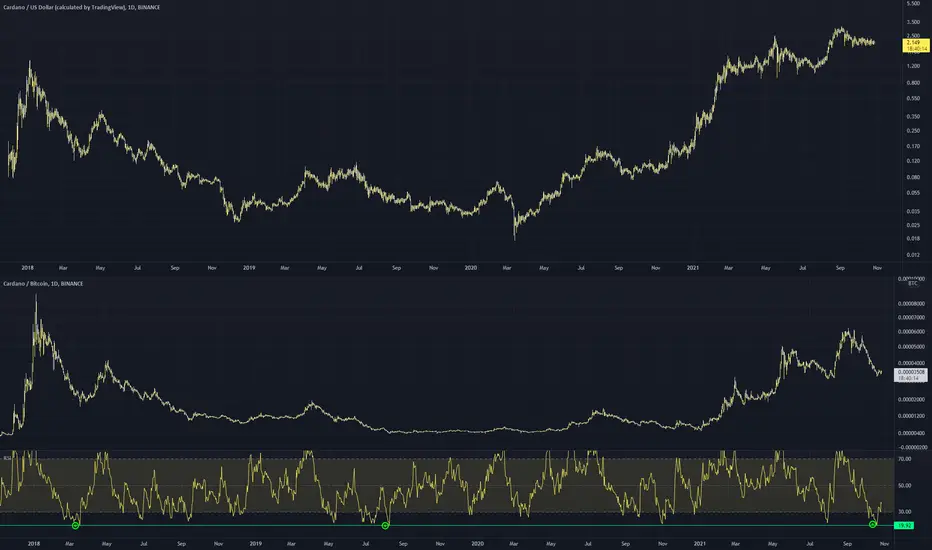
Historically the best time to enter ADAADA is grossly oversold against its Bitcoin evaluation. We've only seen this daily RSI level reached 2 times in the past.
There isn't an argument for the price to follow what happened the last two times as they were on the backend of the 2017 bullmarket.
ADA is at a bearmarket price, and that's where smart money invests.
ADA has one of my highest confidences in securing good profits yet.
ADABTC Long TargetADA is one of the best performing nonshit asset of the market. For the mid November everyone will talk about its performance again.

ADA prepares for aggressive moveADA has consolidated sideways for several weeks now.
USD and BTC pairs are both positioned for upwards movement.
when both pairs move together the movement can be very aggressive. We will wait and see.

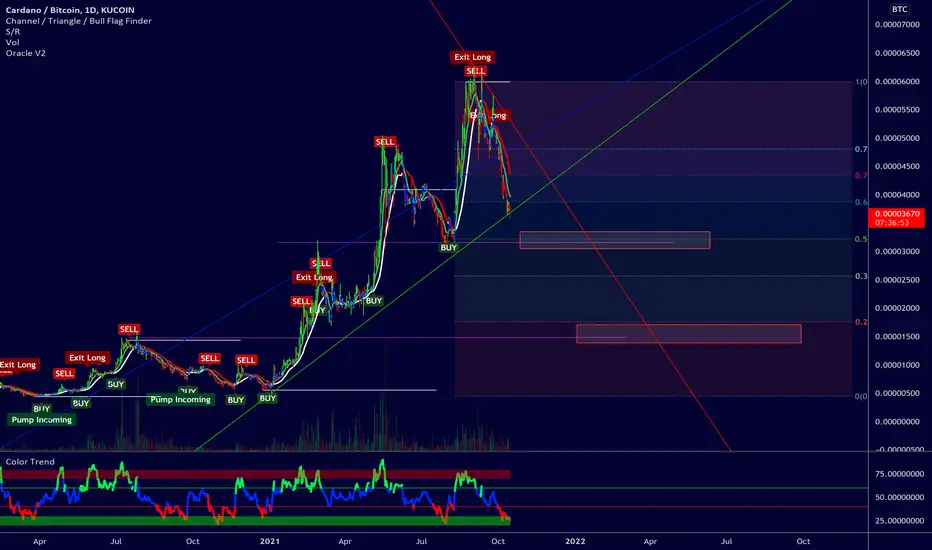
Cardano vs Bitcoin Chart Analysis (ADABTC #7)This is a tough spot here, I will say it before even getting started.
We have the support level marked on the chart.
This support level was hit back in July and this lead to a very strong bullish bounce, 100% of growth.
Then we got a correction and this one has been really strong.
The way the chart is looking, we are likely to see more blood (red) on this pair.
The indicators are bearish and the structure is bearish, the trend as well.
Long-term is bullish but we are looking at it short-term.
Conditions for change
When can this chart be considered bullish?
A strong bounce at support with really high volume can be a good signal to start.
The RSI and MACD both on the bullish side as well.
Moving and closing above EMA50 would be very important to see the bulls taking back control.
Other than that, even after a small bounce, prices are likely to continue to drop.
Namaste.

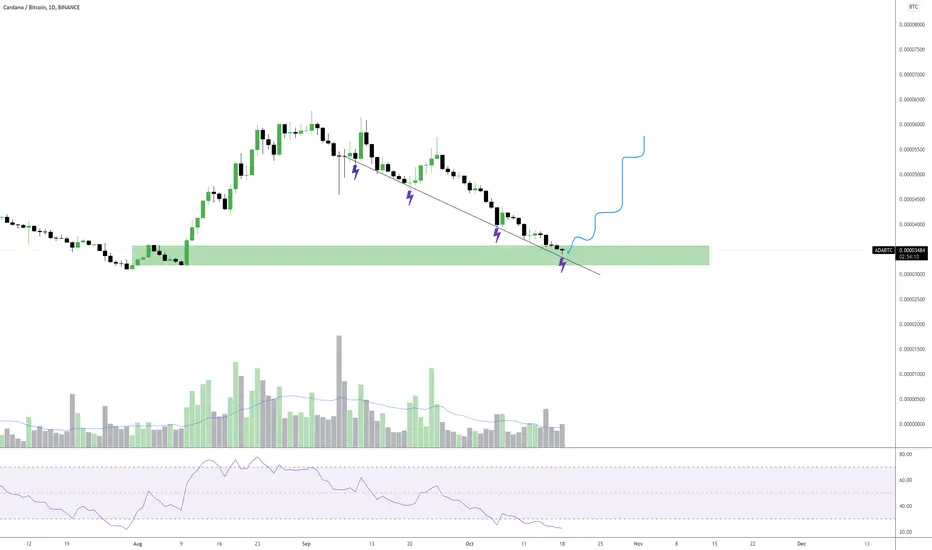
ADABTC - UPDATE 🔔🔔ADA held the major support and we made a first bounce. We now need to set a daily higher low and higher high for a trend change.
We broke this falling wedge bullish
Thanks for taking your time to check out my idea 😎😎! Often, my ideas are fast gone from the front page because there are so many ideas on the platform and the algo picks the one with more likes 🤖🤖. I think once I have around 20 likes/idea my idea will be shown in front 🥳🥳. It would be awesome if you could like my idea, (only if you really like it of course) 🤪! I believe that the more we can interact with each other, and share thought about an idea, the more we can learn! 👩🏫🧑🏾🏫👨🏻🏫
Furthermore, I made a challenge for myself, I will add 1 idea for every new follower🦹♀️ So if I have 1 follower each day, I will add 1 idea. If I have 10 followers, I will add 10 🏌️♂️ It’s fun for me and you! More followers = more ideas = powerful community! 💪💪💪 Besides, all the ideas are … FREE 🥳🥳🥳
⚠️⚠️ If you want to know how my previous ideas played out, > push the play button on my previous ideas and check it out 🕵️🕵️
Is there a ticker you want me to look into? Let me know in the comments below ⬇️⬇️⬇️

(ADA/BTC) !!!!!In this scenario , we analysis Elliott Triangle Wave and Elliott Correction Wave , Now we start a correction wave that show it on chart then we can have a uptrend for 6 until 8 weeks ....!!!!!!!

Risky Bearish Divergence - small scalp potential.
As you can see by the dark red snake trend and price action this symbol made a small correction during a very strong downtrend. Price just crossed the tenkan-sen and could bounce back down.
At such moments I go to a lower timeframe to look at the fractals to see if we see confirmation of price returning to downtrend. There is not yet confirmation of a downtrend and likely the price will keep going up as it made a double bottom on the daily timeframe which can result in sideways behaviour or a strong uptrend. In the case of sideways action we can be at the top of the range at the moment if we see confirmation of a forming downtrend.
However we see a very clear bearish RSI divergence on the 15 minute charts, I am hoping for the price to go down that is wy I set and alert line to notify me when it is going down. In the scenario of it starting to breaking bottom fractals in the lower timeframe after the divergence it is a good moment to make a quick scalp with a small stop loss (previous upper fractal or kijun sen) I do not expect the price to break previous bottom fractal of daily chart but it might as well do. I would be happy with a profit of 1-2%

adabtcfdsssssssssssssssssssssssssss gsddddddddddddddddddddddddddddddddddddddddddddddddddddddddddddddddddddddddddddddddddddddddddddddddddddddd

Looking to enter ADA/BTC? Consider these trend linesI follow the CTM models - Conquer Trading and Investing strategies, with 4 year cycle awareness. They focus mostly on BTC so I aim to expand technical analysis to ALTs
@jclcapital

ADABTC mean what?this mean that all trader
are selling ADAUSD and buy BTCUSD.
and this is mean that you should buy BTCUSD now.
to btc 75000$

ADABTC - BOUNCE INCOMING ⏰⚠️🚨I believe that one of this days we will see some serious ADA pump because we are entering a major demand zone and the RSI is really beaten up.
Last time the RSI was at this level we moved up for about 100%
Thanks for taking your time to check out my idea 😎😎! Often, my ideas are fast gone from the front page because there are so many ideas on the platform and the algo picks the one with more likes 🤖🤖. I think once I have around 20 likes/idea my idea will be shown in front 🥳🥳. It would be awesome if you could like my idea, (only if you really like it of course) 🤪! I believe that the more we can interact with each other, and share thought about an idea, the more we can learn! 👩🏫🧑🏾🏫👨🏻🏫
Furthermore, I made a challenge for myself, I will add 1 idea for every new follower🦹♀️ So if I have 1 follower each day, I will add 1 idea. If I have 10 followers, I will add 10 🏌️♂️ It’s fun for me and you! More followers = more ideas = powerful community! 💪💪💪 Besides, all the ideas are … FREE 🥳🥳🥳
⚠️⚠️ If you want to know how my previous ideas played out, > push the play button on my previous ideas and check it out 🕵️🕵️
Is there a ticker you want me to look into? Let me know in the comments below ⬇️⬇️⬇️
Cardano has room to growADA is testing a nested daily demand zone within a weekly imbalance. Fundamentals are solid. Odd of seeing Cardano taking over the wheel in a near future are quite high

ADA/BTC DailyThis is Cardano's chart to BTC.
- Great macro support line about to be hit which has served as support /resistance on multiple occasions.
- RSI is majorly oversold leading me to believe this is incredibly bullish
- Ties into the ADA/ETH chart where we are about to hit support which makes me more bullish on ADA

Cardano vs BTC and USDT pairingsQuick analyses on Cardano price action.
Spolier alert, its is here and now starting to move up or die like it never died before ;-)
enjoy

ADABTC IDEATell me how u feel about this good, and i need to have more characters for the message so i hope this is enough

ADA broke down the support#ADABTC
#ADA broke down from ascending support line in BTC pair chart. now price face a strong support zone between 0.5 and 0.618 fib of last swing high. also there is divergence between lows of price and RSI. and we can see a long term support in RSI that is near to touch. these reasons may cause a rejection from fib support zone, but it can be just a pull back to broken support around resistance zone or 5000 sats.

Ada/Btc Chart make A divergenceAs we can see that ADA/BTC make a Divergence chart which rsi also be make a divergence now ADA/BTC market condition of bullish but macd now not bullish
Note.The market is normal bullish any time make a big bullish

ADA to BTC Longing ideasI am oh so very tempted to take a long on adabtc... however because we are at the start of a potential strong run against BTC then maybe that would not be wise.
I could see a nice bounce off the higher box, but upward growth could be short lived if BTC continues its rally.
Also if BTC 2x in price like many think it will over the next 30-60 days then we could see these rations totally bleed and maybe hit the second lower boxs..which is about a 50% drop from current rates.
Its always hard to tell. I wont place a long till I see a buy signal print and a clear reversal and will make a stop loss so tight you wouldn't believe.
Cardano / Bitcoin PairingCardano sitting at major macro support on the Bitcoin pairing and very oversold on the RSI.
Bounce imminent

ADA is top heavy against bitcoinADA-BTC big picture charts actually allows for up to 90% correction from these levels.
In the short to mid term up to 40% correction is expected. If crypto bear market starts this could be one of the best shorts on the market, it reminds me so heavily of xpr-btc in 2017.
Cardano pumpers are looking to make themselves a fun September, as this month there are some news about platform developments:
finance.yahoo.com
It could turn out to be a sell on news events, watching this with interest.

Possible We May Have to Wait for Alt-Coin/BTC Pair Bull SIgnal.Let me explain... The ADABTC pair (for example) shows still more bearish potential (Potential for going down more). The only way for this to occur... I say again, "The ONLY way for this to occur is for the following:
BTCUSD to go up MORE (percentage wize) than ADAUSD
-OR-
BTCUSD and ADAUSD to both go down BUT ADAUSD go down MORE (percentage wize) than BTCUSD; in order for ADABTC to go DOWN.
-OR-
BTCUSD to go UP while ADAUSD remains the same (goes sideways).
This same logic can be applied to other Alt-Coin/Bitcoin Pairs...
