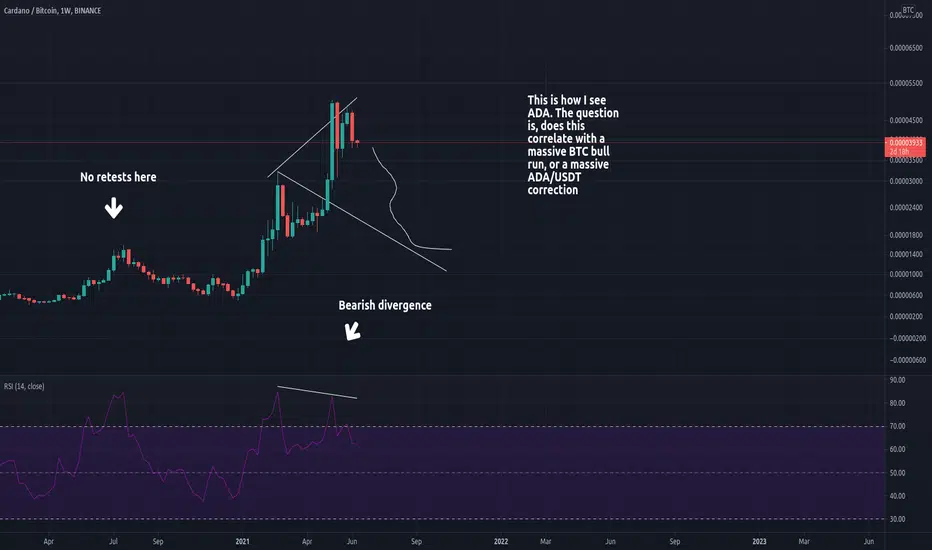
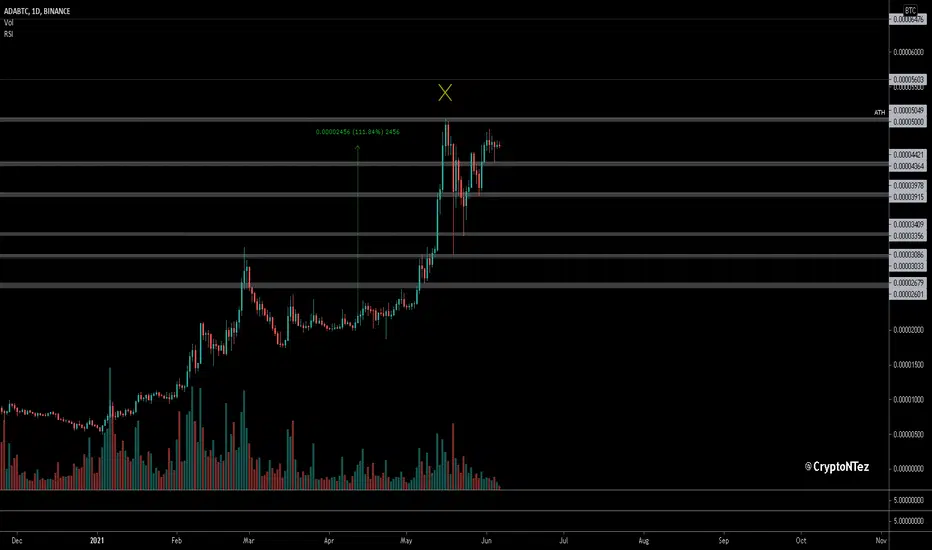
What to you think about this?Where is the wick?
This is the Monthly chart for ADA Cardano with BTC on Binance.
Do you see those two big wicks from 2018?
ADABTC trade ideas

Attention: Buy Cardano now!!!In the Daily chart, ADA/BTC could to entry in the accumulation zone, for that, buy Cardano into this range. We could to forming a simetric trianlge, but never Cardano go down below of 0.000037 BTC. As in my case, I had Bitcoin when I sold Cardano to Bitcoin, but when Bitcoin break down the simetric triangle, I sold my Bitcoin too for U.S. Dollar, but now, Bitcoin form a bull trap and invalided the simetric triangle, and form the bullish flag. For that, I buy Cardano and I hold right now 10,178 ADA, in part that I have in my trading account 1,677 ADA, i re-continue accumulating Cardano to long term making trading. Also guys, I learn that make 200% anual using Cardano asset, I can to get compount interest in this asset, it's mean, if I have 1,677 ADA and sum 200%, I may to get at final of year 3,354 ADA generated in my trading account just make 200% anaul, and that it's profitable to have a trading plan in cryptocurrencies. I don't like to make 30% monthly because I use intraday strategies that I keep my trades during days to weeks, and included month. For that, 200% anual it's profitable for me. So,

ADABTC 4h Inverse H&S breaking to the upsideADA breaking out against BTC on the 4h chart in an inverse head and shoulders pattern with a 25.7% measured move target.


$ADA /BTC, Current view.$ADA /BTC
Current view.
If its not able to hodl ~4k sats area, then ~3400 sats as next level to watch.
UCTS bearish across multiple timeframes (~10% since latest 1D Sell signal)
#ADA
The Liquidity GrabI'm going to do my best here at explaining the basics around a liquidity grab (some times called a stop hunt), why it happens and how it works (ignore the chart I'm using, I'm not saying this is a manipulated move just showing you an example of how it works)
I often refer to this in my playbook as an STL "Sweep The Legs" coupled with a picture of Johnny Lawrence from the karate kid lol
First you need to understand that Big money plays a different game to retail.
When you want to place a buy order at a specific price point, lets say your buying a thousands dollars worth of BTC @ $30,000, you can put an order in and boom it gets hit your filled and your ready to go to the moon.
Now imagine some bigger traders who play with a lot more money than you, lets say there order is more like a billion dollars.
Well in order for them to fill there position, there needs to be a large amount of selling at that level other wise they may only get a small piece filled...... theeeeeen of course the price moves away and your priced out of the market (imagine putting your $1000 order in, only getting $10 of it filled and then having the price moon....yeah it would suck)
They do not want to chase candles or buy up the order book, thats just not good business, and if you have to do that in order to get your orders filled thats a good indication that there is already liquidity issues within this market and you may have a similar problem trying to cover of your position later on.
So these players some times need to hunt down and find or even artificially create liquidity pools for them to take a big bite at like pigs at the trough.
One of the easiest ways to do that is to look for the most obvious levels of support with in a trend of sideways channel and look at the buying thats happening on that level.
If we dont get an instant recovery or bounce at that level it can normally indicate price being trapped or held down in order to encourage more retail to "buy the dip" or buy on support as these are some of the most basic tools and strategies taught to retail traders.
Now one thing to remember when all of these traders/investors are in there positions from this level, there will be a large number of these traders protecting capital with stop losses, normally under the level they where buying at.
This now created a liquidity pool...... You see every stop loss on a BUY order, becomes a SELL order, and with so many BUY orders created and entered at a specific level that means the stop loss orders are stacking more and more on top.
Think about it like this, if we hit 30k and someone buys $1m worth, that means there is possibly a SELL order (via a stop loss) of roughly 1m under that level.... now we hit that 30k level again, and someone buys some more, maybe another $1m worth... well now there is roughly $2m worth of SELL orders in that stop loss zone. Hit that 30k super sweet safe support level 5 or 6 times and all the sudden you could have 8-10m worth of SELL orders at a single price point below support.
Now if I wanted to enter this market long and I had 10m order to fill, it would make sense for me to run the price down to clip these stop losses creating a large amount of selling straight into my pig of a buy order.
Once my orders filled I can stop holding the price down and let the price begin to organically rise again, this often creates fomo for all the retailers who just got knocked out of there trades from "tight stop losses" to chase the market back in only adding to the momentum and mark up of my position.
The same thing can happen in vice versa when they are covering or exiting a position as well, and its often followed by a square up to reduce or remove the risk taken on to manipulate the price during there accumulation or distribution of there order, more specially into a short position as they take on more exposure to the underlying asset to manipulate the price, in a long there exposure is fiat and there isnt any need to cover. (ill explain square up in detail next time)
This is often what is referred to as a liquidity grab and its how big players enter the market, they do not chuck a limit order in on Binance and hope for the best...
I hope that made sense and added some value, but if you have any questions please chuck them below

ADA/BTC short setup
...Very simple setup, strong movement south and than consolidation for some time, be aware that Emma here is holding any gains nicely.
This price action strongly suggest that further downtrend should be continued...
R/R ration is healthy and it is close to 2.

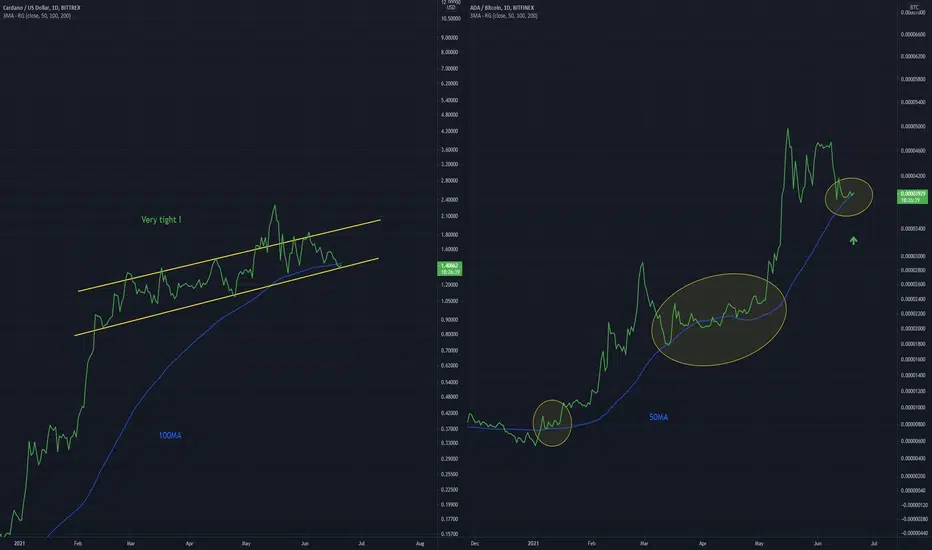
ADA Tight Trading Range, Breakout ??On the USD pair ADA can be seen to be moving in a very tight range, I notice this a lot prior to massive breakouts upwards, which is very possible in this case
Just touching the 100MA
On the BTC pair another retest of the 50MA is in progress, each time this has occurred a bullish rejection was the result, likely another rejection upwards
I do not hold ADA but this looks great


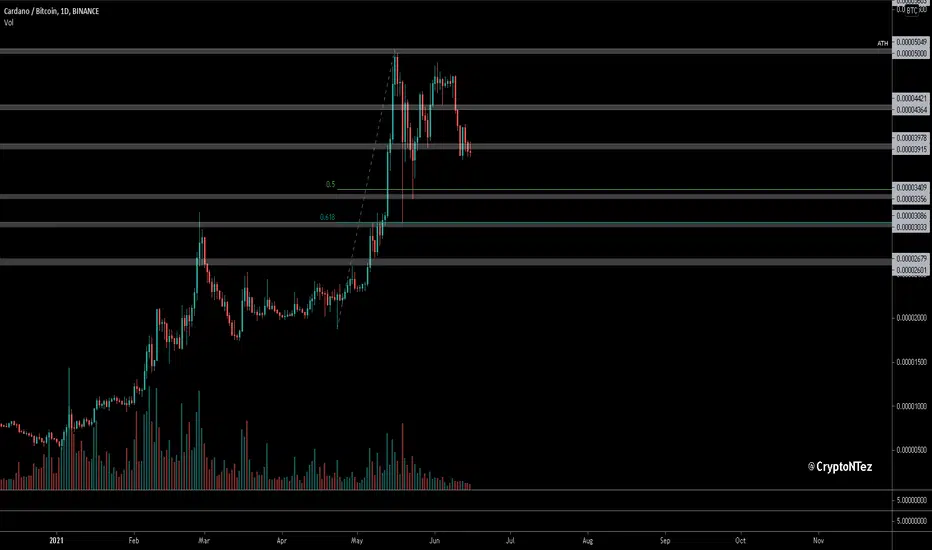
ADA/BTC Forming another bullish flag. Moving towards ATH.Cardano is moving towards new ATH considering the ADA/BTC chart.
Currently we ca see the formation of a second bullflag since the head and shoulders breakout.
We expect some more consolidation before an upwards breakout.
Smart contracts are around the corner and money is coming towards ADA.
With its proof of stake mechanism it also is energy efficient.
Basic rules:
- Never buy the top/ATH
- Take profit as long as you can (also partial profit is profit)
- Use Stop/loss for leveraged positions
- If you are not experienced, don't leverage in the first place
Enjoy the ride and don't be too greedy.
If you like the content, please like, comment and give this channel a follow.
We would love it if you could share your thoughts in the comments.
Discussions are very welcome here.
Always do your own research and keep in mind that my charts and comments cannot be considered financial advice.
Cheers
ps.
Chart explanation:
Main lines:
- Green lines are tested support lines.
- Orange lines are resistance lines or, if we are above, possible support lines which were not tested yet.
- Cyan line is for volume trendline.
- White lines are Fibonacci retracement levels
Helplines:
- Purple lines are trendlines we take a look at.
- Blue, white and pink lines are 200MA, 50MA and 20MA.
- Yellow lines are for visual help only.
Boxes:
- Either entry zone or support zone. Check the description.

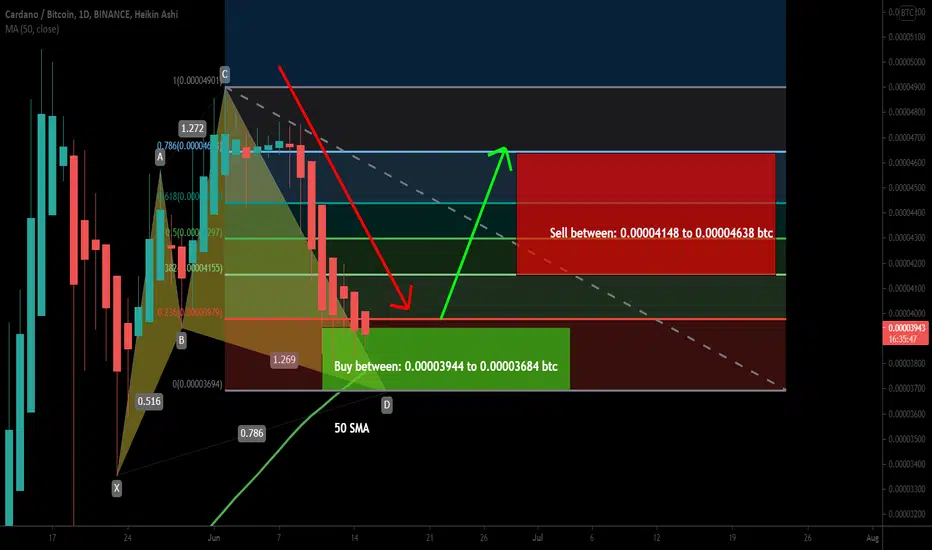
Cardano (ADA) formed bullish Cypher for upto 25.5% rallyHey dear friends, hope you are well, and welcome to the new update on Cardano (ADA) coin.
Previously we had a nice trade of ADA:
Now on the daily time frame chart, the price action of ADA has formed a bullish Cypher pattern. There is also additional support of 50 simple moving average in the buying zone.
Buy and sell targets:
Buy between: 0.00003944 to 0.00003684 btc
Sell between: 0.00004148 to 0.00004638 btc
Stop loss:
The maximum extent of potential reversal zone 0.00003684 btc can be used as stop loss.
Possible profit and loss ratio:
As per the above targets, this trade has a big profit possibility of 25.5%, and the loss possibility is 7%.
Note: Above idea is for educational purpose only. It is advised to diversify and strictly follow the stop loss, and don't get stuck with trade.
ADA.BTC (Y21.P4.E1).Still downward pressureHi All,
Based on the indicator and formation, I see ADA and many ALTs losing ground to BTC in the Short term.
Only a few coins that might do well against BTC.
All the best,
S.SAri

Perhaps!Is this fall possible?
It does not matter much.
I drink coffee, smoke and write screenplays these past few days.

ADABTC is testing an important trendline 🦐ADABTC is testing an important trendline after the price created a triangle. IF the price will have a breakout downward and flip the current support (daily one) into new resistance, we can see a retest of the weekly support (red one).
According to Plancton's strategy (check our Academy), we can set a nice order
–––––
Follow the Shrimp 🦐
Keep in mind.
🟣 Purple structure -> Monthly structure.
🔴 Red structure -> Weekly structure.
🔵 Blue structure -> Daily structure.
🟡 Yellow structure -> 4h structure.
⚫️ Black structure -> <4h structure.
Here is the Plancton0618 technical analysis, please comment below if you have any question.
The ENTRY in the market will be taken only if the condition of the Plancton0618 strategy will trigger.


I sold my Cardano coins to Bitcoin right now!!! Why?We see that the ratio Cardano/Bitcoin or ADA/BTC it's bearish as Bitcoin take strenghten in the trend. That it's a clear signal that we would need to sell our Cardano coins to get Bitcoin and conserve our Bitcoin power. I sold today 10,566 Cardano coins and get 0.45 BTC (Bitcoin). This it's a bearsih signal if you look ADA/BTC. If you have any doubts, that it's a comparison to know what asset have more power if you look how Bitcoin and Cardano up, this chart ADA/BTC it's used to know what cryptocurrency it's more powerful. That you can to look with ETH/BTC (Ethereum/Bitcoin), LINK/BTC (Chainlink/Bitcoin) and much more to know this secret strategy that nobody talk about how the alcoins work.
s3.tradingview.com
And this it's the weekly timeframe, this it's sound bearsih for ADA/BTC.
Now, if I have 0.45 BTC, if Cardano down to 0.000032 BTC, then, I use the following. a calculator and I divided the 0.45 BTC with the price what Cardano could to reach, in that case it's 0.000032 BTC. That mean that if this happen, I can to get 14,000 Cardano coins or little more when I hold 0.45 BTC and hope that ADA/BTC down to 0.000032 BTC. That you can to apply with ADA/ETH, that it's a different ratio, but if you using ETH/BTC you can to understand more.
Good luck!!!

$ADA,less than 10% away from ATH..$ADA
As reference, less than 10% away from ATH on a 50%+ recovery from the dump.
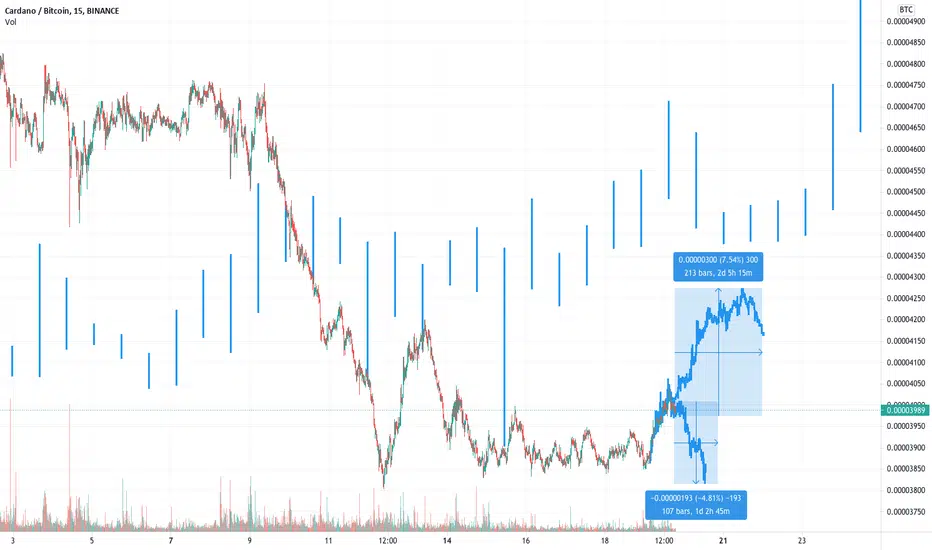
Does a consolidation period for Bitcoin favor swing trades?Just testing here to see whether we can reliably jump out of and back into Bitcoin with specific trades. I've selected 3h timeframe here because it overlooks volatility and appears to be more predictable with respect to trends.
In this scenario, once ADA / BTC broke a downward 3h channel, nearly 12.5% upside was realized. I've set up a specific BTC pair watchlist and will be updating this idea as I work through whether or not this will be helpful in winning back some of the recent losses.
Not financial advice or recommendation whatsoever. It does however call out that there may be strategies out there you can build upon yourself to find success in the near term while we wait to regain our bull of all bulls.


Cardano (ADA) Is Poised To Leave Bitcoin In The DustCardano has broken out of the daily chart triangle range, and has held above this range for the better part of a week. This resilience should translate to much higher prices in coming months, with further market share concessions going to Cardano.
