Cardano Boppers 34 The Cardano breakout on Bitcoin has barely begun, I'm not worried about touching this investment, please hold your ADA bags forever. I'm more interested in Bitcoins 100k challenge. Watching ADA on the bitcoin means our breakout could occur in a BTC crash ! Or totally not, I have a few and hope 100 thousand price is accepted this year. Cardano has the potential to multiply regardless, but drop your philosophy in the comments :) PS: The American Stimmy just passed cost more than the total crypto market-cap.
ADABTC trade ideas


AFTER 2 WEEKS OF MASSIVE MANIPULATION TO THE DOWNSIDE! ADABTCADA BTC pair is finally getting released from it's shackles! Watching the bloodbath that was the ADA/BTC chart over the past 2 weeks. ADA is finally seeing the light of day! CAUTION! More Manipulation could still be in PLAY! I'm personally looking to long after a foothold over 0.00001900 is found but THINGS ARE LOOKING UP AND WE SHOULD BE READY FOR AN INTENSE BREAKOUT!

Is ADA dead?ADA recently had a huge pump, and has since dribbled down on a solid dump without a pullback over the two or three weeks since the peak.
Price is now approaching a strong Daily Level Equilibrium, which lines up beautifully with the 50 Fib of the Higher timeframe move
Below this we have two Daily Demand zones, the lower lining up with the 61.8.
The trendline formed on the daily closes is also rising up to meet price, and if we continue down, should meet price at the same time it reaches the first demand zone.
CCI is showing Bullish Divergence on the 4H
Therefore, There's a high probability of ADA continuing down to find support at one of the zones, and then bouncing. I've staggered orders to catch this bounce, with a SL below the lower demand zone.

VERY Bullish scenario for ADA/BTCCardano continues VERY VERY bullish in short and long term.
BUY : above 0,00001772 and 0,00002053
STOP: Bellow 0,00001655
Profit: 0,00004065
A 100% of profit
Please leave a coment.
THANKS

ADA new ATH!!? (⊙_⊙;)BINANCE:ADAUSDT BINANCE:ADABTC
Hi guys , As we saw in this week we have finished our main pullback and we are starting to go up generally in crypto market .
For ADA according to what I see in the charts we can go for a new ATH soon , currently in cardano/btc chart we are in a very important level of Demand also we have hit the 0.236 Fibonacci level and showed Resistance to it , this level also matches with 200 4h EMA too and we are in OVER SOLD stage, so we can expect resistance from this level and its a very important level to keep an eye on for now.
Also we have a long time low in ATR that that indicates we will have a huge move soon.
So my suggestion is to have an eye on ADA because we are in a very important level.
If my idea was helpful for you consider liking it ,leaving a comment and following me for more content!! Thanks!! ^_^

ADA BTC - down down downBig drop for Cardano to Bitcoin.
We'll see it go back to the previous market structure.
Bitcoin is too strong for most alts to compete with.

ADA/BTC Trend ReclaimADA just reclaimed this up trend, good place for a long entry with stop behind 4H OB in my opinion

ADABTC PAIR IS BREAKING OUT!WATCH FOR A REBOUND OFF THE TRENDLINE! IF we bounce we could easily see a bigger move to new ATHs! Do not trade until we have a confirmed bounce! If you get in now I'm confident you'll be profitable within at least a week but we want to wait to see if we can get a better ticket on the train so to speak!

ADA 1HR Buy Potential Potential buy on ADA 1HR
This is not financial advice, please invest at your own risk

This level is keyIncreasing volume at the marked price range is going to confirm the end of the consolidation and the trend continuation on ADABTC pair.

ADA just had a blow-off topWhich marks the end of the pump, now period of distribution will follow which will likely cause ADA-BTC to correct some 30%.
After that it is likely that it will continue to bleed out for months until it comes back to starting point between 800 and 1000 satoshi.

BTC TO ADA LONG PARLAYBTC TO ADA LONG PARLAY AFTER CLOSING BTC LONG POSITION
MIDTERM TRADE SETUP
NOT FINANCIAL ADVICE

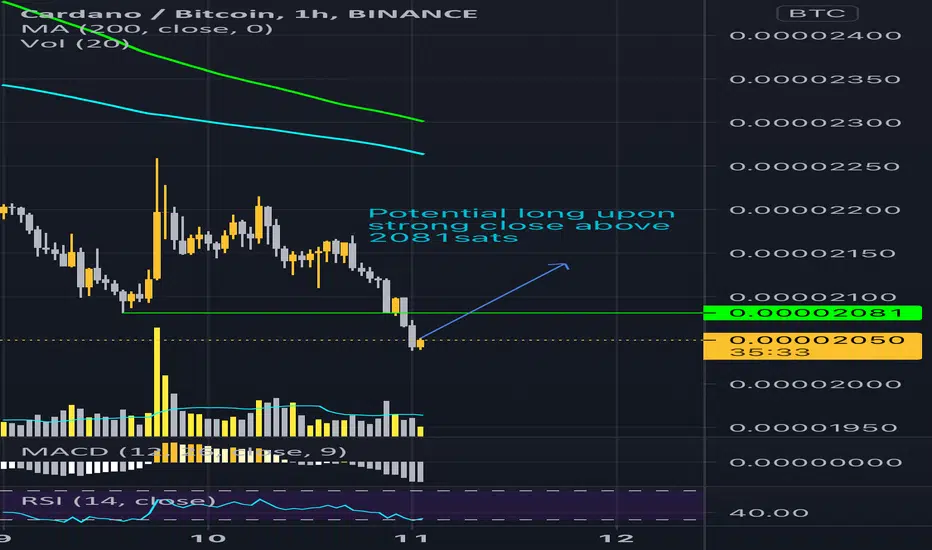
ADA BTC PAIR INDECISIVE!!WHAT FOR CRITICAL SUPPORT around 2100 SATS! If this breaks too heavily we could be headed for the mid 1900s SATS BEFORE a V-SHAPED RECOVERY!!!! IF this happens or if it holds 2100, I expect a brand new buy round to begin with exponential GAINS!! KEEP YOUR EYES PEELED!!!

ADA BTC BREAKOUT!!A double bottom has formed for the ADA and BTC trading pair AND it is breaking out of the descending triangle!! Be prepared for a major RALLY!!


Bottoming outThe ADABTC pair looks like it's bottoming out soon. Maybe we get a stab lower to 21's, but I don't think we'll see a breakdown.
Just my opinion, good luck.


ADA and BTC Pair Very Bullish happeningsAs stated previously, The ADA BTC Pair is in a very bullish pattern. (eg the bull flag) but I found it interesting that both times it dipped to the low side out of the formation it dropped significantly and then was bought back up within a 5 minute time frame both times! This is a very good sign and I'm eager to see this develope further! Good Luck out there everyone!

ADA BTC PAIR THE FUTURE AHEADThis is a concept of what I believe to be ADA/Cardano's trajectory for this bull run! Keep in mind that on the way to these price points there WILL BE MAJOR CORRECTIONS of up to 40-60%!!!!! DONT FORGET IT! BE MENTALLY PREPARED!

ADA and BTC pair WATCH CLOSELYWe have broken out of the descending wedge and have entered a very bullish flag! Watch for continued trading in the support and be prepared for a breakout! Potential for breaks to the lower side are possible but less likely!
