ADABTC - 1D - Double bottom or ... more dumpNot financial advice!!!
After several days of huge dumpage...
ADABTC looks like it is
1) forming a double bottom
2) RSI & Stoch RSI Bottomed
3) Volume decreasing
what's next?
-More dump
-Some pump
ADABTC trade ideas


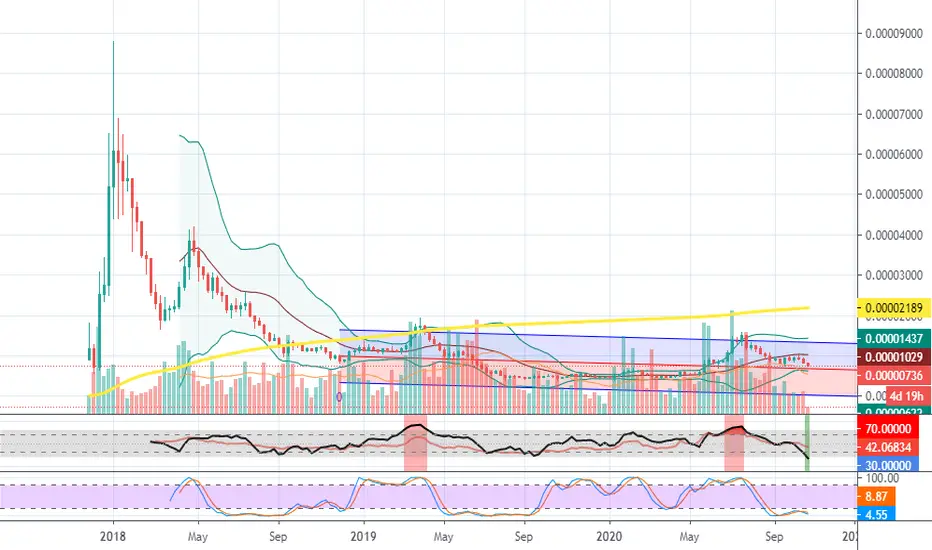
ADA Cardano Signals oversoldThis is the 1st time Cardano on the weekly has given us an oversold on the MFI.
The stochastic RSI has been oversold since late August.
The issue is that the Bollinger band is opening up and the price will continue going down with it.
Drop below the midline Linear Regression and we could end up at the bottom channel.
My strategy here is to buy in and dollar cost average until the price increases.
ADAUSDT Cardano maybe a pullback dailyADAUSDT Cardano maybe a pullback in daily
if we have two green candles we can say its pullback and it will go for 0.00001 and then 0.000014 and if it breaks upper trendline it will go for so much higher that i will say later


bullish divergence on ada/btc pair 4HThings are looking great on smaller and on the bigger timeframe. bottom is in?

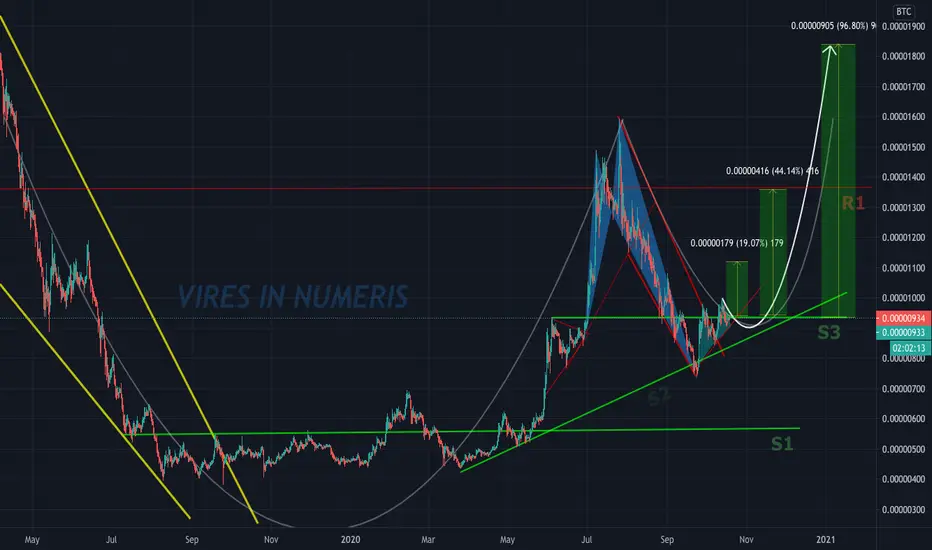
Cardano Long Term Drop (October 24th-July 15th 2021)Cardano/BTC exchange rate (October 24th 2020 through July 15th 2021)
Low: 0.00000325 ADA/BTC
High: 0.00000855 ADA/BTC
Here's a bit of my timeline for Cardano through July 2021.
From now (October 24th) until December 26th, I believe Cardano will sink to around 0.00000325 BTC. During this time, it could make a stop to around 0.00000425 BTC around November 21st, bounce up to 0.00000548 BTC within 2-3 weeks (December 5th-12th,) and then continue descent down to 0.00000325 BTC by December 26th finally.
After that, Cardano could move sideways from December 26th 2020 to July 15th 2021, fluctuating between 0.00000325 BTC to 0.00000548 BTC for that time being before next cycle gets going.
Related short term weekly forecast below:
Thanks for tuning in :) Disclaimer, I am not responsible for any losses incurred while attempting to use my data, I hope this can prove to be some sort of learning tool for some and give insight as to how I personally come up with my own numbers. Take into full consideration this could be a completely bad forecast. Cheers

Cardano Weekly Drop? (October 24th-Nov 1st 2020)Cardano/BTC exchange rate (October 24th through November 1st 2020)
Low: 0.00000744 ADA/BTC
High: 0.00000844 ADA/BTC
As I write this currently, what I see are some moves down. I will post a more in depth forecast soon but we could reach new lows in the next 2 months, from what I can tell.
Thanks for tuning in :) Disclaimer, I am not responsible for any losses incurred while attempting to use my data, I hope this can prove to be some sort of learning tool for some and give insight as to how I personally come up with my own numbers. Take into full consideration this could be a completely bad forecast. Cheers


$ADA #CARDANO Perfect setup imo. Targets on chartAfter correction formed a reversal bullish triangle as shown on chart along with targets.

CARDANO ROADMAPFor information on BTC volatility follow our BTC ROADMAP chart.
Libertas Aequitas Veritas.
[Watch it] ADA may exit range soon.OBV broke resistance and CMF is pointing to zero. Possible inverted H&S. Slight bullish divergence on daily MACD.
Keep an eye on ADA as it may break its range.
Bias is upwards, we'll see.


ADA/BTC Turns Bullish? (+58% Potential Profits)Hello Traders,
As we can see here on the daily time frame for Cardano (ADA) on Binance, there may be a potential breakout from the falling wedge being printed since the peak of the large bullish wave. As we can see, ADA had peaked around 1600 satoshi on its last rally. Additionally, we can see an even bullish flag/wedge of sorts forming over the last week or so. The immediate targets for this are marked by the green arrows, around 1100 satoshi.
This coin has printed a higher low (blue box) and broken back above the 10, 21, 50, and 200 EMAs, and is now pushing to break out above the 100 EMA. We have nice, increasing buy volume coming in. The MACD and RSI have also both been rising steadily, adding to the bullish sentiment. As such, I am strongly bullish on this coin.
I am already in a long position for this coin, but a potential short-to-mid term trade setup now could be:
Entry: 900-1000
Support: 750-850
Take Profits:
1 - 1100 (+12%)
2 - 1315 (+36%)
3 - 1525 (+58%)
Share your own thoughts and comments down below. Also, leave a like if you liked the post and follow me for more ideas!
Price at writing: 959 satoshi.

Ada Trading PlanHello Traders,
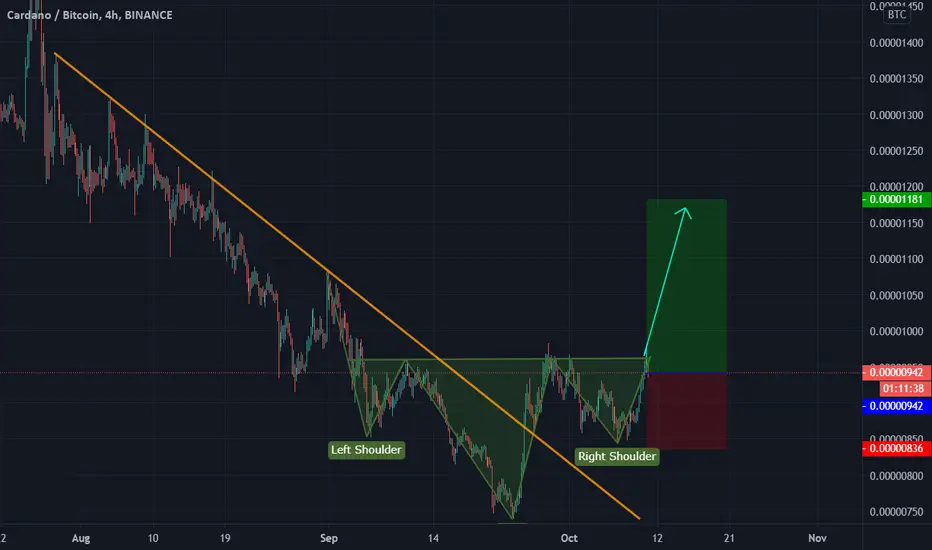
Cardano did a head and shoulders formation and it seems that will continue its upward movement. We could recommend opening a long position if it does a pullback to the green zone.
For more analysis like this please push the like button and follow us.


Still waiting for the breakoutHey guys, nice to see you back.
Last time ADA and BTC didn't helped in our trade and we have been forced to close it because it has been invalidated. This time we have a new opportunity with clear signals.
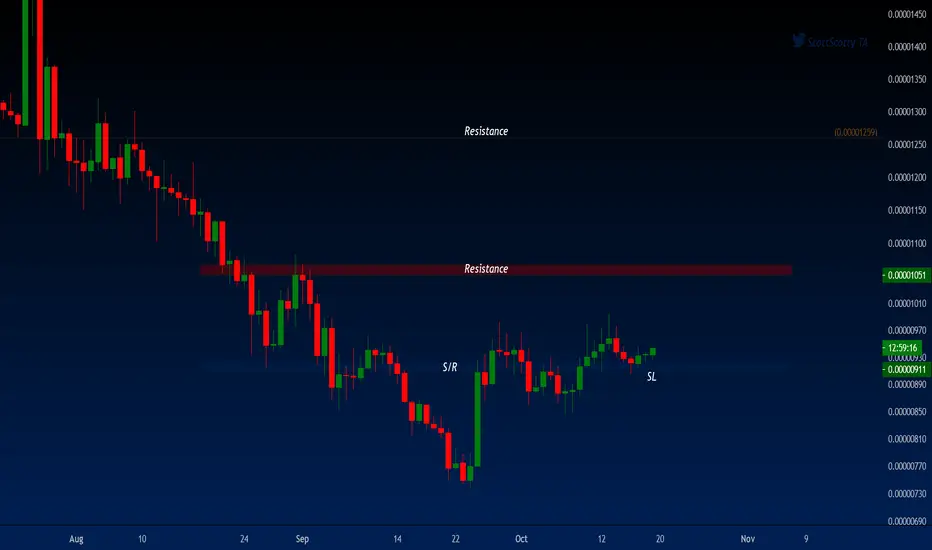
On the daily we can see a bull cross of the EMA 12 and 26 happening for the first time since April. In general the first cross usually fail to turn bullish and fade after a week. But the context here is very particular we have a clear resistance in the 980/986 sats area and the correction from July has been already severe so we may consider the cross as the start of the second bullish wave. Another interresting clue is the cross and confirmation of 907 as our new longterm support. Monday we should see an attempt to break the resistance at 980 if everything goes as expected, from there we should also have more information about the relevance of that cross and the resistance.
On the weekly we can see the trend consolidating over the EMA 26 and where the EMA 12 is also in the 970/980 area. Everything seems to say that this week we will see a move.

ADABTC creates an inverse head and shoulders 🦐ADABTC creates an inverse head and shoulders and its neckline is the weekly resistance.
IF the price will break the neckline with volume and retest the neckline as support According to Plancton's strategy, we can set a nice order
–––––
Follow the Shrimp 🦐
Keep in mind.
🟣 Purple structure -> Monthly structure.
🔴 Red structure -> Weekly structure.
🔵 Blue structure -> Daily structure.
🟡 Yellow structure -> 4h structure.
⚫️ Black structure -> >4h structure.
Here is the Plancton0618 technical analysis, please comment below if you have any question.
The ENTRY in the market will be taken only if the condition of the Plancton0618 strategy will trigger.