ADABTC trade ideas

Inverted Head and Shoulders on ADA BTCOpened a long position here already and I'll deploy more capital if the market turns up. Targeting a 25% move above the neckline.


ADABTC Daily S/R| Bull Flag| Stoch Equilibrium| 200 EMA Evening Traders,
Second analysis – ADABTC –breaking above Structural S/R, price acceptance at this level will be bullish.
Points to consider,
- Bullish Price Action
- Daily S/R Support
- 200 EMA Resistance
- Stochastics Equilibrium
- Declining Volume
ADABTC’s current price action is bullish, trading in a probable bull flag, This allows us to have a bullish bias on the market.
The Daily S/R is immediate support that is in confluence with the .618 Fibonacci. Price holding and respecting this level is a bullish bias.
Resistance is poised by the 200 EMA, breaking this will coincide with price hitting technical and validating the bull flag.
The stochastics is in a valid equilibrium, a break in either direction will coincide with price movement.
The volume profile is declining, this is indicative of an influx when testing key levels such as the Flag and Daily S/R resistance.
Overall, in my opinion, ADABTC is a valid long with defined risk, price action is to be used upon discretion/ management of trade
Hope this analysis helps
Thank you for following my work!
And r Timing, perseverance, and ten years of trying will eventually make you look like an overnight success. – Biz Stone
emember,


$ADA / BTC Update for $ADA - looks as though support could hold although there is a clear "M" bearish formation (see callout on chart)

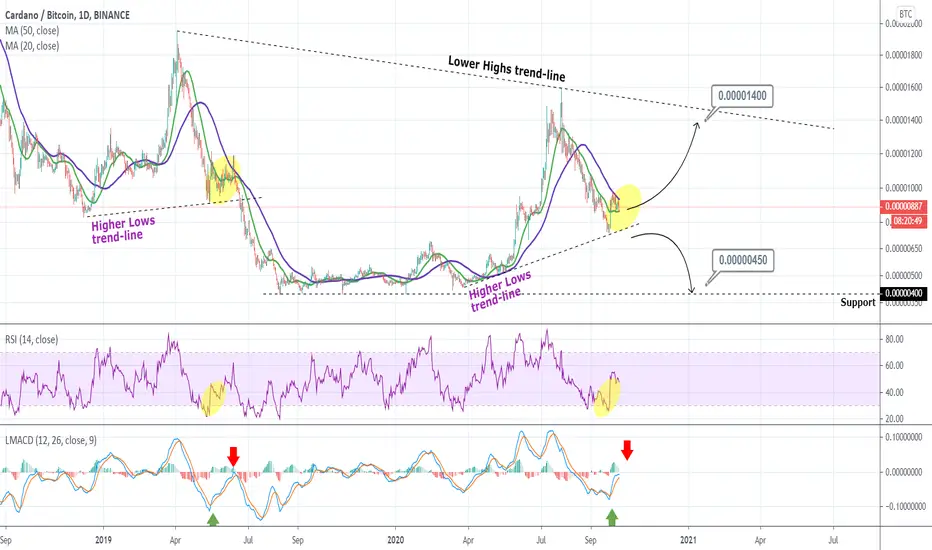
ADABTC Trading planPattern: Higher Lows on 1D.
Signal: (A) Buy as long as the Higher Lows trend-line holds, (B) Sell if it breaks.
Target: (A) 0.00001400 (Lower Highs trend-line), (B) 0.00000450 (Support).
** Please support this idea with your likes and comments, it is the best way to keep it relevant and support me. **
--------------------------------------------------------------------------------------------------------
!! Donations via TradingView coins also help me a great deal at posting more free trading content and signals here !!
🎉 👍 Shout-out to TradingShot's 💰 top TradingView Coin donor 💰 this week ==> Hunchocrypto1
--------------------------------------------------------------------------------------------------------

ADA bullish & bearish scenarioPlease feel free to share your view on this pair down below in the comment section. I'm more than happy to be challenged and have an interaction on this idea.
Also make sure to leave a like as it helps me out a lot!
------------------------------------------------------------------------------------------


Cardano (ADA) Retracing (Next Target Mapped)Cardano (ADABTC) is about to close the current 4H candle below EMA10...
We also have the MACD peaking and showing a young bearish cross as well as the RSI trending lower.
Prices are likely to drop...
The next target is marked on the chart based on Fib. proportions.
Note: This is not financial advice.
You need to have a plan/strategy before you trade.
Charts are always changing, please keep this in mind.
Thanks a lot for your continued support.
Namaste.

ADA-BTC triangleGreetings,
the altocoins began to correct, but not all.
On the 4-hour chart of the ADA is drawn a triangle, the exit from which will give 20% movement to the support or resistance zone.
If the idea turned out to be useful for you, support it with likes. I also remind you that I have a telegram channel, the link to which can be found in my profile, where I place ideas more often, and intraday trades.

ADA to outpace BTC growthThis was covered in previous post... but ADA will likely follow a linear lead ahead of BTC for a week or so before moving parabolic against BTC.... which BTC alone could move with parabolic strength towards end of month.
This play could last around a month (150 tiks).
Backtested strategies and moving evidence support this. I will not be mad if this ends up being the best call I have ever made.
Cheers

ADA/BTC - Reversal in play?I believe ADABTC has put in a reversal on the 1D chart, signalling that dips are for buying.
Technical reasons for the trade:
→ Price spent a few days below the 1D 200MA before quickly powering back up on volume.
→ Confirmed bullish div - Histogram and RSI.
→ Fisher bullish div + buy signal on 25th September.
→ OBV back above its 13EMA.
→ Bullish engulfing candle on the weekly.
✗ Price hasn't yet given us a nice market structure on the daily chart.
✗ Big VPVR notch below, if bulls don't step up and price fails to remain above the 1D 200MA - we could see a drop down to 682 sats.
✗ 1D 200MA has yet to be retested as support.
✓ Aggressive traders can look to long all pullbacks.
✓ Safer traders can look to long when/if 1D market structure is established.
Good luck!
Hit the LIKE button if you find my analysis valuable and want to support me. Follow to make sure you don't miss any future trade ideas.

ADA Outpace This setup looks promising off of historical data and the prospect of outpacing any BTC moves. Despite a high RSI... this position could last up to 26+ days.. so that's irrelevant in the long run.
I've found this to strategy to be effective on the 4h timeframe because it does not give up on short movements when the long term momentum is still pulling upwards.

ADABTCtenkensen broke kijunsen and chiko in the free area and komu cloud is asending
in multiple time frame analysis we see the long position
stop order upper the last candle and stop loss under the kijunsen


ADA BullishADA forming a perfect cup & handle pattern
Holding Huge support at 800sat
Weekly Bullish Divergence
