Cardano (ADA) formed bullish Butterfly for upto 13.50% moveHi dear friends, hope you are well and welcome to the new trade setup of Cardano (ADA) coin.
On a 4-hr time frame, ADA has formed a bullish Butterfly move for another price reversal.
Note: Above idea is for educational purpose only. It is advised to diversify and strictly follow the stop loss, and don't get stuck with trade
ADABTC trade ideas

ADA to 17k satsOn the above 3-day chart price action has corrected almost 70% since the sell signal back June 2021. Ever since price action has been in a downward channel. A number of reasons now exist to be bullish, including:
1) A strong buy signal. Look left.
2) Price action breaks out of Bull flag and confirms support on past resistance.
3) Price action bounced off the golden ratio.
4) The flag pole extension measures a 780% move to 17k sats.
5) On the 10-day chart a text book Cup and Handle formation has printed (below).
Is it possible price action falls further? For sure.
Is it probable? No
Ww
Type: trade
Risk: <=6% of portfolio
Timeframe: 3 to 9 months
Return: 7x
10-chart cup n handle

ADA/BTC Cardano is too weak stay above this historical trendlineToday, I analyze the BINANCE:ADABTC Weekly chart, Logarithmic scale. Observe where price is sitting at the time of writing. It is sitting at the crossing of two trendlines and the 0.5 Fibonacci line. This conjunction may serve as a good support for price, meaning that price would not go below 1500 Satoshi ever again. However, that's the extent of bullish factors that I could find on this chart. Let me detail my Bearish factors:
1. The volume across the entire timeline of ADA is almost non-existent when price is above the the 0.5 Fib line. Consider the 0.5 Fib line as a separator between two zones of price action. Any price action above it I call high , and below it, low . Price has traded high for a total of 33 months. It has also traded low for the same number of months. So the trade time between high and low is almost equal. However, the volume is enormously skewed towards the low price action. You can see that on the volume profile appearing on the right side of the chart. Low-price action has 5 times the trading volume of low-price action. Bear in mind that the price axis is logarithmic, so our 0.5 Fib line sitting at 1523 Satoshi does not stand exactly at the middle price between All-time high (8788 Satoshi) and all-time low (266 Satoshi). So I can easily say that 80% of trading volume has occurred in the lowest 20% of prices, and the highest 80% of prices have only seen 20% of the trading volume. Therefore, the high prices carry no significance. Trendlines mean almost much less above the 0.5 Fib line. Using that reasoning, I predict that the two lines crossing below the current price will not stand as support and that price will break below them.
2. The more touches in a bear market to a trendline, the more probable it will break on the next touch. This principle is also validated by descending triangles. I can't see an exact descending triangle pattern here, but price has been in a bearish trend for 6 months now drawing lower highs and lower lows.
But what about Fundamentals?
People get easily excited about news bites such as "Solidity is coming to Cardano", "Haskell can now run on browsers", "Cardano's Formal Verification can catch devastating flaws that cost Millions". The reality is the world is not that black and white. Most investors have absolutely no idea what any of these news lines mean. What really matters is the psychology of the market, i.e., how the market feels about these news, thus Technical Analysis!
On top of that, as a Haskell programmer and a Formal Verification specialist myself, I know full well the scalability challenges that come with such "positive" news. Ultimately, what drives price up is hype and survival instinct, not fundamentals. You can ride that wave up if you want, but when reality hits and the network clogs, some hack steals millions, or the hype withers away leaving Cardano once again a hulk in crypto space; it may be too late to implement your exit plan.
So, what next?
I anticipate price to revisit the lower rising trendline and stay in that zone to allow for redistribution/accumulation. In that phase, moving averages and oscillators like RSI will catch up. From there, we can revisit the Cardano chart to judge if it's ready for another boom.
Keep an eye on this chart. Access it here .

ADABINANCE:ADABTC
i like to see more bears to touch the support prices
it have big market and big holders
also i like this chart
share yours with me

ADABTC UPPossible rise in the last corrective wave, It will be a final rapid triple rise in order to correct what happened in the previous five downward waves
✳️ ADABTC 300%-400% Potential 8X Lev.This is the last one that I didn't mention last time but went live with... ADAH23 or ADABTC.
We are being conservative with the targets... It can always grow more but with lev., it isn't necessary to hold that long.
We can get in and get out, get in and get out.
Remember to do your own research.
Leveraged trading is high risk and can incur full capital loss in the form of a liquidation.
If you can't take a loss, then trading is not for you.
Some trades are winners others are losers, that's just how things work.
The goal is to learn how to play the market to reach the finish line with positive results.
Potential can reach from 300% to 400% with 8X lev. depending on your final target.
Thanks a lot for the amazing and continued support.
Namaste.

FREE ALTCOIN ANALYSIS REQUESTThis will be done on monthly basis. Your request will always dictate what my post will be. Let get this stated.
✳️ The Higher Low Is In, Prepare For A Higher High | ADABTCThe lows hit 20-25 January looks solid/strong enough to be considered a higher low vs late December...
The September downtrend has been broken, the trading volume has gone up, the RSI stays strong.
Cardano is moving above EMA10 today vs Bitcoin, ADABTC, while Bitcoin continues to grow.
We are getting signals all across pointing to the Altcoins vs Bitcoin (ALTSBTC) pairs moving up together with Bitcoin which only happens within a very strong bullish wave.
Looking for a trade?
This chart setup can produce a trade signal with great risk reward ratio.
Tight stop-loss, below 15%, with hold as potential target to aim at 50, 80 or even 100%+.
Namaste.

ADABTC 50% Drop Incoming?We've received a Sell signal through Crypto Tipster v2 on Cardano / Bitcoin on the longer term 2D chart - although there is a level of support right where the market is currently sat, if this level was to break the next support area is a whopping 50% below the current price.
The next few days will be critical to watch on this one, a small downward movement beyond this level of support will ultimately break downward for some serious Short profits.

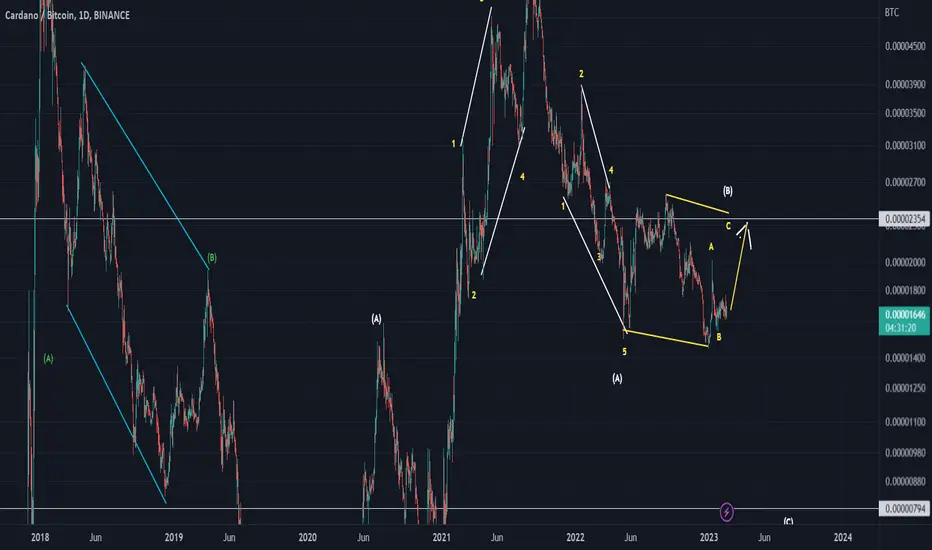
ADABTCThe Cardino is expected to fall to one of the two areas specified below, to close the bearish C wave, and thus it will end three historical bearish waves that extend over five years as a correction.

ADABTCADA looks good and I think we can trust it and publicly we see a positive movement in the coming days.

ADA targets within reachwaiting for reaction if/when we hit my blue targets which I have had on this chart for over a year .. waiting patiently ..

ADABTC Weekly Timeframe. Are the bulls coming back? Are the bulls coming back into ADA as we retrace and find a bottom at the .78 Fibs?
For more information visit - www.facebook.com

ADABTC can drop hard if the 1W MA200 is compromised1W chart representing the ADABTC pair on the current and previous Cycle. There is a clear Resistance and Support Zone and based on where the Stoch RSI is following the 1W MA50 (blue) rejection, we are expecting a strong drop if the weekly closes below the 1W MA200 (orange). If it is unrealistic to expect ADA to lose so much ground and revisit the Support Zone, then based on the Fibonacci levels, we can aim at the -0.13 extension (0.000009).
## If you like our free content follow our profile to get more daily ideas. ##
## Comments and likes are greatly appreciated. ##
## Also DONATIONS through TradingView coins help our cause of increasing the daily ideas put here for free and reach out more traders like you. ##

ADABTCHello Crypto Lovers,
Mars Signals team wishes you high profits.
This is a one-day-time frame analysis for ADABTC
Based on our last analysis on November 1, we expected a rising trend to happen and our prediction came true in the current chart. Here we have R1 as our resistance area that has the disability of price to rise. And S1, S2, and S3 are the support areas which all express the well support of price at different points. Therefore, we have the fluctuation of price below R1 and we predict a falling trend to happen for it toward S1 and by experiencing a recovery trend, again another decline is waiting for the price down to some lower amounts. Remember that our analyses are providing you several information and details in order to help you have logical trades with proper profits. So please keep moving with us and support us.
Warning: This is just a suggestion and we do not guarantee profits. We advise you to analyze the chart before opening any positions.
Wish you luck
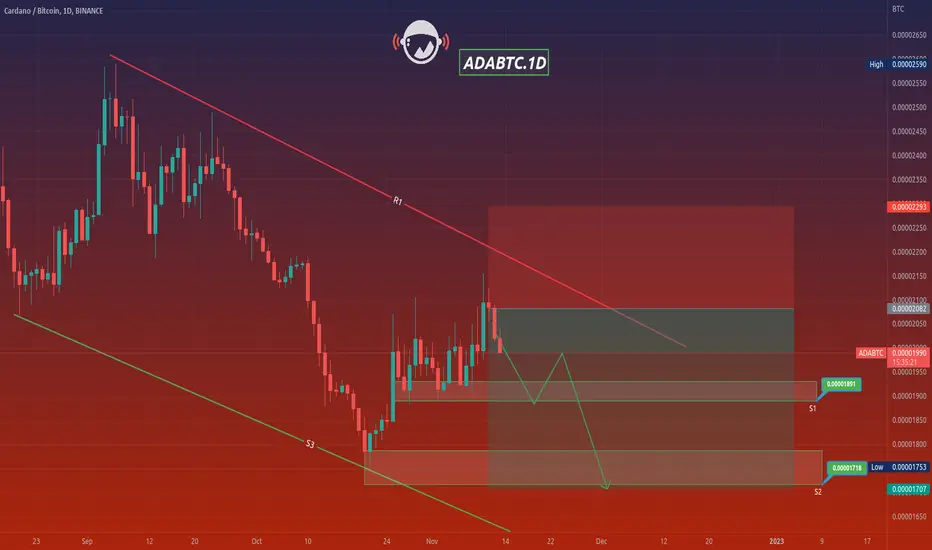
ADABTCHello Crypto Lovers,
Mars Signals team wishes you high profits.
This is a 4-hour-time frame analysis for ADABTC
Here we have R1 as our resistance line which includes the disability of the price to rise. S3 used to be a long-term resistance line and S1 and S2 are the support areas. Presently, we have the price fluctuating over S1 and we predict a fall for it down to S2. There we must wait for some rising signs and then another rise is waiting for the price to reach S1 or even higher amounts. In case the price fluctuates over S1, more rise is possible for it. Even we may have more fall for the price when it reaches S2 and its support is lost.
Warning: This is just a suggestion and we do not guarantee profits. We advise you to analyze the chart before opening any positions.
Wish you luck

Bitcoin devil - COPY BOT / BTC base currency / ADA/BTC=== Time window ===
01 / 01 /2021 - 20 /10/2021
=== Example settings ===
Initial capital = 1 BTC
Stop loss = 8%
Trailing percentage = average amplitude of weekly price movement
Arm Trailing = standard deviation of amplitude
sell based on strategy = Disabled
DCA = Disabled
Cool down = 12 hours
=== Base currency ===
BTC
=== Disclaimer ===
All strategies and templates presented by Bitcoin devil are created and optimized to aim at maximum profits. However, always preform your own research and risk assessment. Our backtest results are only meant to give an indication about the performance of the strategy. Past performance does not guarantee future results. Use our products at your own risk. Bitcoin devil is not a financial advisor and not responsible for any losses. Before purchasing any of our products or services please inform yourself with the Terms and Conditions on our website.

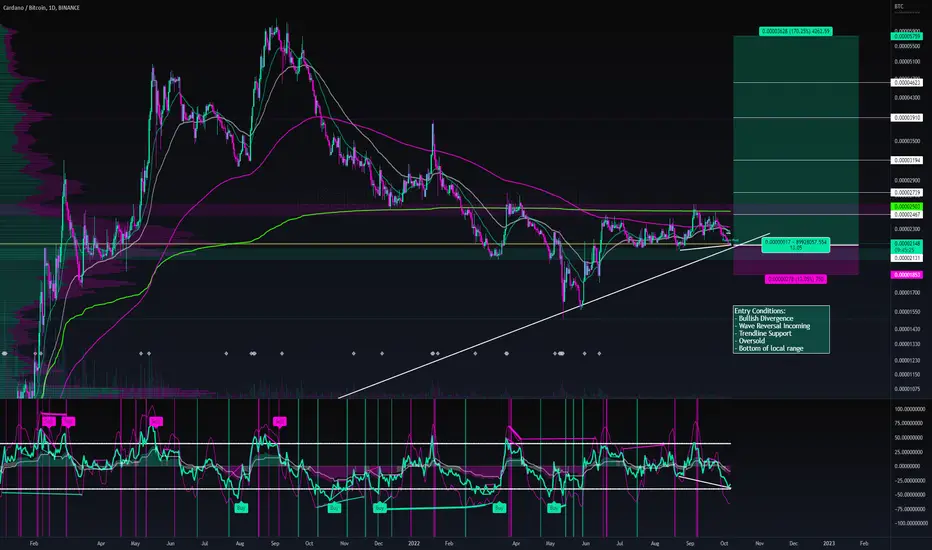
⚡️ #ADA/BTC - Potential 170% - Long - Daily ⚡️⚡️ #ADA/BTC - Potential 298% - Long - Daily ⚡️
All targets & analysis displayed on chart
Entry Conditions:
- Bullish Divergence
- Wave Reversal Incoming
- Trendline Support
- Oversold
- Bottom of local range
ADA/BTC
#ADA/BTC
Exchanges: Binance
Signal Type: Regular (Long)
Amount: 2.0%
💎 Entry Targets:
1) 2138- 2102
Take-Profit Targets:
Target 1: 2231
Target 2: 2291
Target 3: 2340
Target 4: 2389
Target 5: 2430
Target 6: 2472
Target 7: 2546
Target 8: 2587
🚫 Stop loss:
2058

time to buy some ada 50% profit aheadhardfork nears - don't go all in but risk some money on it - quick job

$ADA- updatebounced from its 200 on the daily check earlier graph for HTF
am looking for a break of this downtrend
dip below blue line i'm out
Vasil fork should give it some momentum imo with all low caps chilling out once btc breaks out either way

$ADA- buy nownext narrative after the merge is going to be the vasil hard fork due end of sep
bouncing from the 200
should outperform other large caps
target 50% plus imo

ADA-BTC FIRST TARGET DONE +27 % PROFIT DONEADA-BTC
BUY : 0.00001895
SELL : 0.00002431
PROFIT : 27% DONE
Related words: trend line - support level - price channel
congratulations to our team
