Cardano vs Bitcoin | Tricky Yet BullishCardano is going bullish vs Bitcoin (ADABTC).
Why tricky?
We have a challenge of EMA100 today after a bullish flag, pretty clear.
We have strong consolidation above EMA10, clear and strong.
This is tricky because if we see a red candle close today, it would negate these signals and instead of up down we go.
That's the tricky part.
Cardano vs Bitcoin can rise but only after we get a bullish candle close.
Namaste.
ADABTC trade ideas


Bullish or another leg down ?Ada is trying to cut loose from BTC and is forming a symmetrical triangle near the Falling Wedge Channel
Which way can ADA break?
Ada has been silent after breaking the downtrend and needs to break away from BTC for major gains.
Given that most Alts are pumping, I think it might have a slightly better probability of breaking higher.
Let's see exciting week ahead

ADA/BTC 4hr Chart Update by sharmaji14u
ADA / BTC 4hr Chart Update by sharmaji14u
Hello Dear Freinds....
RSI showing also Bullish & MACD also Bullish cross over
So Don't Miss This Big Opportunity
Entry & Target in Chart
I hope freinds you understand my analysis.
Me & my Team trying to best analysis for you Freinds.
~~Please Support Freinds~~
(Not Financial Advice)
~~Best Of Luck~~
!! Thank You My Team !!

$ADA/BTC 1W (Binance Spot) Huge symmetrical triangle breakoutCardano has pulled back towards 100EMA and is preparing for the big bull-run to come, time to full swing!
Current Price= 0.00002886
Buy Entry= 0.00002893 - 0.00002513
Take Profit= 0.00004463 | 0.00006935 | 0.00012294
Stop Loss= 0.00001998
Risk/Reward= 1:2.5 | 1:6 | 1:13.6
Expected Profit= +65.11% | +156.57% | +354.83%
Possible Loss= -26.08%
Fib. Retracement= 0.618 | 1.117 | 1.764
Margin Leverage= 1x
Estimated Gain-time= 1.25 years
cardano.org

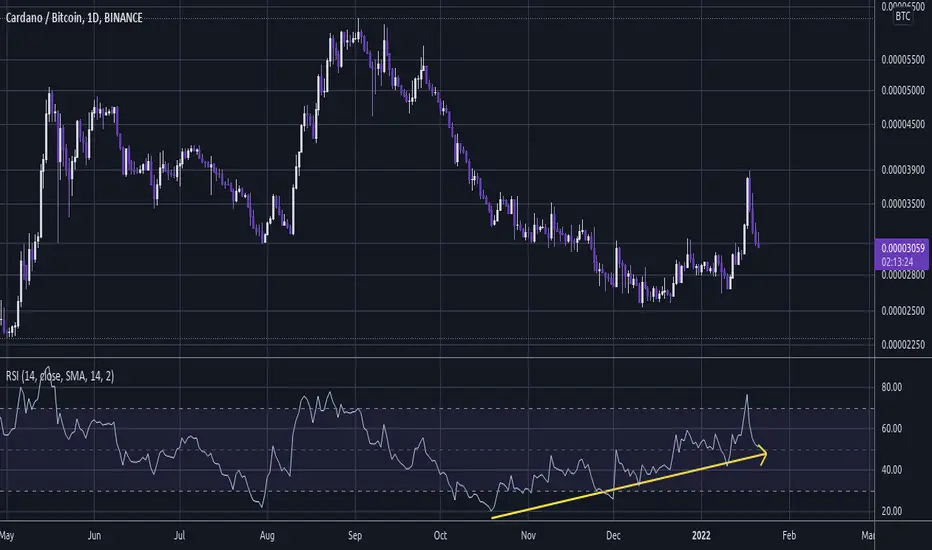
Cardano vs Bitcoin Daily Timeframe AnalysisI am seeing it but it comes with a strange feeling...
Sometimes when you have the chart with the technicals and clear signals, the feeling is the contrary and many times this "contrary" feeling is what tells us that everything is just as it looks.
The chart for Cardano vs Bitcoin (ADABTC) is now bullish, by all standards.
We have bullish indicators, RSI and MACD.
A bullish breakout and the entire Altcoins market starting to wake up.
You can see my daily short-term targets on the chart above.
Thank you for reading...
Thank you for your continued support.
Namaste.

ADA BTCTHERE IS A BREAKOUT ON 30 MIN TIME
AND I SEE A BULLISH MOVEMENT
SO BUY IN DEEP AND ENJOY THE RIDE
Bullish harmonic pattern is showing it's reversal zone
MACD crossover is showing bullish momentum
Expecting a big upward move from here 🚀
Targets are mentioned in the chart

ADABTC approaching big supportCardano/Bitcoin approaching big support -
s/r level, .786 retracement from last impulse low, and VAH of entire chart from 2018

ADA near bullish Harmonic Gartley- 5 clear waves to the downside, with RSI divergence between wave peaks, tell us the end of the impulse.
- Order Block near Gartley target.
- Fundamentals help, Cardano is top 10 in coinmarketcap and is one of the few that still strong since 2017.
I would WAIT still, to break any little figure inside the red bar confirming the bottom, a head & shoulders, a double bottom, a falling wedge break, a symmetrical triangle break, flag, etc.

ADA/BTC has started its move!!!GUYS, im excited to share this with you! This is a falling wedge on the daily timeframe of ADA/BTC and we are on the verge of breaking it this time. Whether we break it today or get rejected today, there is one thing thats guaranteed and its that the breakout is inevitable. a breakdown should be impossible as it would mean that ada/btc would drop to like 0.00001 and below. People that call ada trash might probably say it IS going 0.00001 but i dont see it possible. The more hate ada gets the more bullish that is. The breakout target of the falling wedge is 0.00003. ADA TO THE MOON

Cardano consolidating in a range Cardano consolidating in a range you can take a long position after brakeout on a 15 munite candlestick closing or wait for a retest

Why ADA Remains At RiskAfter a fresh bearish reaction, Bitcoin price extended decline below the $42,000 support level. There was a clear move below the $40,850 support level and the 21 simple moving average (H1).
The price dived towards $40,000, but the bulls appeared near $40,120. Recently, there was a minor upward move, but the price faced sellers near $40,950. It started another decline and traded below a key bullish trend line with support near $40,800 on the hourly chart.

ADA scalping setup 🔻Hello traders.
Ada's chart seems good for a quick crossed leveraged small-cap short position.
open short if the candle closed under the resistance.
Warning: this is not a piece of financial advice always do your own research.

ADA/BTC before to go beyond ATHI expect to see lower RSI values on weekly basis with a double bottom. Then it may go up beyond ATH

ADABTC - Still In An Uptrend 🧐Chaos everywhere and firstly to point out that SPX has crossed the 200MA for the first time post "new world." If there is a major crash ADA will get flattened. Jut to be realistic here.
But that aside its well worth noting that ADABTC looks very optimistic and still moving upward in preparation for a BTC bounce whenever it comes.
This does not look like a chart ready to crash imo . It looks like the start of a new trend and the daily bullish divergence seems to very much agree with that.
Perhaps there is something ADA algos know that we don't.
Either way its a bullish chart - for now.
That said if SPX continues much longer under the 200MA I will probably exit and chart from the sidelines. Its just risk I dont need to take.
Not advice.

ADABTC Not looking so good 🐻 📉 🐻Hi everyone 👋🏽
🕊 Wish y'all have a profitable lifestyle 🍀
📌 ADABTC- Weekly Time Frame - Candlestick
📌 Price Action - Fibo - RSI Divergence
📍ADABTC 's chart is not looking very good in every time frame from weekly to 2H. It is completely bearish in every aspect
📍 Price may have already finished its 5th cycle in the white horizontal line and it may see the 0.38% fibo , 0.5% and 0.618% which is the most important one.
✍🏼 A very powerful hidden divergence RSI is very visible to see in the weekly time frame which has already taken the price down
⚠️ HOWEVER, you should not consider this TA as a bearish sign for the ADAUSDT pair itself because it is based on ADABTC pair, and it has 3 meanings:
1- ADA 's price is dumping faster than BTC 's price (Both are going down together, but ADA faster🐻)
2- ADA is not growing as fast as BTC (Both are going up, but BTC faster 🦬)
3- ADA is dumping and BTC is pumping (ADA is going down and BTC is going up)
✍🏼 From EMA point of view, in weekly time frame price has broken 50 EMA and is going as fast as possible to hit the 100 EMA, which is overlap with 0.38% fibo level
✍🏼 In daily time frame a negative cross may occur between 200 and 100 EMA and can be a bearish signal for long term
THIS IS NOT A FINANCIAL ADVICE
PLEASE DO YOUR OWN RESEARCH BEFORE TAKING ANY SELL OR BUY POSITION
GOOD LUCK
NP TRADER

ADABTC Long | ADABTC Short | You can trade long or short⬜ This is two trade what I took for ADA, Cardano on Delta Exchange. This is publish for my personal trading journal but maybe can be good for someone (I like to come back on my past trading and check what was good and what can be improved).
⚪ Trade is taken on weekend when mostly is low volume and when I saw possible Elliott Wave idea and this least for me is not new trend to break ATH I jump in Long. Have trade plan where to place Stop Loss, and what is my Targets.
Taking profit I done based on my plan for trade, again using harmonic pattern indicator and already some possible resistance level.
When reached last preset target (180% ROI) I close all trade.
⚪ Same happens for Short trade. When I saw rejection.
I saw rejection from weekly resistance and based on last long trade, this is not impulse wave, maybe just larger correction, I took short trade when I saw strong rejection and didn't bounce from 1st support (expected maybe will broken resistance flip to support).
Break bellow expected resistance, tested, can't break above (perfect for entry) and continue trend down.
Rest of this trade is on chart where and why I took some profits.
Remember ALWAYS plan your trade and trade your plan. Use Stop Loss and have Targets where you will take profit. Don't be greedy and don't forget to take profit off the table.

ADABTCADABTC already come to Cypher and maybe is ok to watch this area for long. We see nice confluence with golden pocket too.
I hope will not visit 0.886 fibonacci where to come to PRZ (potential reversal zone) for Deep Crab harmonic pattern.
Stay safe and good hunting.

ADABTC: Summary of Price Action From Super Macro to Short TermHi Everyone! I provided a brief summary of what to look for in each GROUP of time frames. What GROUPS ? ? ? Super Macro, Macro, Long, Mid, Near and Short Term GROUPS of time frames.
Give me a few minutes to post a screenshot of "each" GROUP of time frames previously mentioned in the video...
Happy Trading and Stay Awesome!
David

ADABTC - SuperSmootherADABTC breaking out here with a 12% move against BTC. Its looking very good for ADA with BTC turning bearish today. This shows positive sentiment for an ADA pump but also it shows that a BTC bounce may be on the cards in the not too distant future.
Also worth noting that ADAUSD is currently 9% green today against the BTC dump.
As I've said in previous threads, whenever BTC bounces ADA is going to pump.
Anyhow I've been browsing TV indicators finding trend tools and here's a good one for trend channels - the Supersmoother.
Similar to bollinger bands and other trend channel tools, but this one seems particularly good for finding reversals and breakouts.
Here can see the lower bands were threatened as the smoother drifted sideways post descent. But then in the sideways move, price has rose into the upper territory.
And now price has broken out above the upper bands, showing that this is probably not a fakeout, this will most likely become a rally of significance.
Also Guppy turning bullish blue again indicates the same.
Fibs showing possible EW targets. Price can consolidate 1.618 in this area and move on potentially.
Not advice.

$ADA, UCTS signalling a new buy after the fakeout$ADA
Take two.
UCTS signalling a new buy after the fakeout
I took it already but if you want to add a second layer of security, aim for a breakout above the green area..
#ADA

Dubious SpeculationFib extension from previous cycle high. Large cup and handle point to 1.27 maybe.
At BTC 150,000, this would put ADA at $18 USD.
