ADABTC - LONGADA looks to be entering a new cycle. Exiting a strong accumulation phase with a support breakout, we might start to see some strong growth over the next month.
ADABTC trade ideas

ADA BTC Head & ShouldersADA Looking like its producing a HS formation.
Proof:
Prior move is Major Intermediate Down Trend
2 M of elapsed Time in the formation
Volume is slanting down.
Fundamentals:
Sundae Swap Impeding Release will cause demand for ADA
ADA has held while other coins have dumped as of yesterday. Seems like tight accumulation
Neck at 3131
Shoulder Peaks at 2600
Going forward:
The Right Shoulder may complete symmetry at 2600. Possible if Sundae is delayed.
Right Shoulder may NOT Complete Symmetry if Sundae Main net is announced.
The RS not going to 2600 is a bullish sing. If you are waiting to accumulate lower you may not get a chance. Any left over funds should be converted @
Entry:
3131 Daily Candle Neck break
When volume is larger than previous 2 days volume from incident of neck break.
Entry price will be higher than 3131.
Stop @ 2990
Targets:
3500
4192
4600

ADABTCThe price has broken line and i think it's wave B of correction. Look at indicators. It can affect on ADAUSDT, so i think ADAUSDT wants start to fly. Be careful about your position.

ada btcas i expected , news helped the cardano price , so its looks to have some bullish days in futures , if cardano can stay above the red coud .

ADA - Hold On To Your Hat 🤠Can you feel the doom and gloom for ADA - well thats about to change as ADA will be heading north with impulse soon enough.
Looking at the @BoneFunkenstein moving fibs tool, price has trended under the lowest fibs for the first time since March '20 crash. It did once dip below this time last year but it was very brief.
This shows that price is very beaten down here and - much more than other alts and BTC.
Guppy 4H trend tool has twice turned bullish blue now and it has popped back above the lowest fibs.
As I said in previous threads; any BTC bounce and ADA will most likely pump.
Not advice.

ADA reversal path factors?ADA reversal has been waited for a long time. What could be the factors that drive ADA back to higher support bands?
Short-term indicators show potential but long-term, lagging indicators are more bearish.
There could be a new correction and then up unless strong enough momentum to get us past the resistance levels.
No financial advice.

ADABTC#CARDANO #BULLISH retest the broken support level.
I see a hidden bullish divergence in weekly
I bought some here and ill wait for confirmation for revers. then I will add more.
targets marked on the chart
remember BINANCE:ADABTC its weekly chart

ADA analysisCardano has attractive terms in terms of technical analysis, if you have a downward correction you can buy
buy = Blue Line

ADA/BTC not far from breaking out.We have an inverted head and shoulders on the .618. We also have a confirmed macd bull div on the daily. Good location, good momentum and good structure. I am targeting the 50% of the previous move down.

ADA - Will Pump Soon 🚀I dont normally post twice on the same name in the same day, but ADABTC is looking bullish suddenly while BTCUSD wallows.
Massive bullish divergence on the daily RSI and a nice domed bottom also an iH&S.
Collapsed 59% /BTC and 65% /USD - ADA has been well beaten, but you can't keep a good name down and this looks ripe for the bounce right here.
Should pump into a wave 3 here upon any BTC bounce.
ADA is ready 🚀
Not advice.

Ada/btcCardano has insane dump from $3 to $1.0 and pullback
Its similliar with icp/usdt
And agan,ada/btc wyckoff accumulation
May someone have idea with this?

ADABTCHello Crypto Lovers,
Mars Signals team wishes you high profits.
We are in the 4-hour time frame. You can see that the price has broken our resistance line S2 and has made its correction to the support line S1. If the price stabilizes above the S1 line, you can buy it here for the shown target. If it goes below the S1 line the next support would be the S2 line where you can buy.
Warning: This is just a suggestion and we do not guarantee profits. We advise you to analyze the chart before opening any positions.
Wish you luck

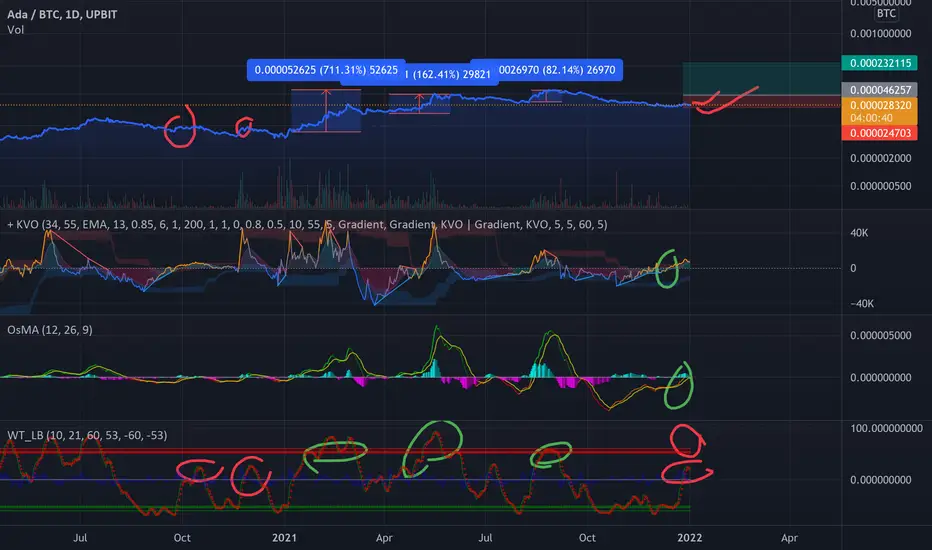
Cardano does not look ready for reversal, wait further 2022Q1The long-term technical indicators show that we may have to wait for the reversal for the Q1 of 2022.
Look for the tool such as Decision Point Oscillator.
No financial advice.

ADABTC looking for a rally ! BTC looking a little scary but if it will stay over 40k it will be fine.
Ada against Btc on weekly rsi looking like it is going to have a rally next week.


ADABTC/LONGwaiting for breakout the trendline,ichimoku cloud and Price stabilization above 0.000031.

Cardano ~10x gains after BTC halving in 2021, over extenssion?This is historically interesting that Cardano reacted very aggressively with upward momentum on the time of BTC halving.
Aggressive over extensions can be followed by severe corrections and oversold situations, look for RSI indicators.
No financial advice.

Potential Bull trap in CardanoCheck intermediate timeframes before executing any trade!
There are a mix of signals currently in ADA, Cardano, the safest is wait for the intermediate time-framed RSI indicators go over 50.
Be patient.
No financial advice.

UPDATE: ADA BTC UP 253% after bull signal - What Next?Please Like or Follow if you enjoyed this content.
UPDATE: The price jumped 253+% after the bullish Supertrend Ninja signal in Jan 2021. And 125% in April 2021. The Supertrend Ninja also predicted some heavy drops with the latest being in Sept.
The price is ranging, which is visible from the sideways movement. RSI is in a range as well. Although ADA got a bullish signal from my indicator Supertrend Ninja. Right now the price is in the middle of two grey blocks. Supports and Resistances are highlighted as grey blocks. Next support around 2500 sats. Next resistance around 3250 sats. Price is still on the negative side of the Ichimoku. Break down here, we will go to 1900 sats.
Profits can be taken at each grey block. Supports and resistances are drawn using the indicator 'Yo Show Me Some Support - and Resistances'. Pun intended.
Thank you for reading.
Namasté 🙏
What Indicators Do I Use:
In the chart I am using my Supertrend Ninja indicator, which is a trend-following indicator (Green and red vertical line with arrows).
When the background of the candlestick closes green (vertical line) with an upwards pointing pink arrow. It indicates a possible bullish (up)trend.
With each trade proper risk management is essential. Either by using my script Trailing Stoploss Bottom Activation indicator, visible as grey dots below the candles. Which sends an alert, when current price goes below the previous candle low. Or using my Heikin Ashi Trailing Stoploss Activation, the indicator below with green and red blocks. Or third option, exit when the Supertrend Ninja indicator displays a vertical red line with a downwards pointing black arrow. Remember, the first stop(loss) is always the cheapest stop.
Disclaimer: Ideas are for entertainment purposes only. Not financial advice. Your own due diligence is highly advised before entering trades. Past performance is no guarantee of future returns.

ADA: Pi Cycle bottom 30% away and the Top 150% awayThe Pi Cycle bottom is 30% away and the top 150%, it is interesting whether ADA will again break through the Pi Cycle bottom.
Windowing: 1 year time frame
Historically, ADA had multiple overbought situations during the year 2021 and now the valuation levels are becoming more normal and overvaluation is disappearing.
No financial advice.

ADA Breakout not yet, coming in the 2022-Q1?ADA breakout not yet but coming nearer, watch out for oscillators.
Light at the end of the tunnel?ADA has been held underwater due to heavy resistance from the Death Cross. However, on the 4-hr chart, price is holding above the 200 EMA for the first time in months. If this can hold, the dominos may start to fall as consecutive Daily EMA levels are broken to the upside. Now, let's take those rose-colored classes off and realize that it's also likely that price is rejected from any of these levels and we see continued downside pressure. On the bright side, we are in a Falling Wedge pattern (Bullish). Unless there some Fundamental reason the sell-off will continue (bad news, etc), I'm expecting a significant bounce once the trend resistance is broken. Consider averaging in, but be careful not to go too heavy just yet.
These are just my observations and should be considered financial advice. Do your own research and reach your own conclusions before investing.
Cheers, and Happy New Year!
---------------------------------------------------------
I'd love to hear your thoughts, ideas and feedback. Feel free to comment and I'll try and get back to you quickly.
If you appreciated this analysis, consider Liking or Following. Thanks!

ADABTC LONG ADA VS BTC now is situated into a falling wedge pattern which means the price is going down inside the channel but a breakout will occur soon.
Lot of bullish signals you can see in my analysis:
-RSI about to breakout from triangle
-Stochastic crossing bull but we need a lot of more volume
Target is 3161 satoshi from this channel
Good luck, have a nice day guys
3D chart= Bullish divergence and MACD is about to cross upside
Ada USD
Same like for BTC, situating into a falling wedge which means will break UPSIDE
ADAUSD sitting into major supply zone so it s a good time to place some longs
