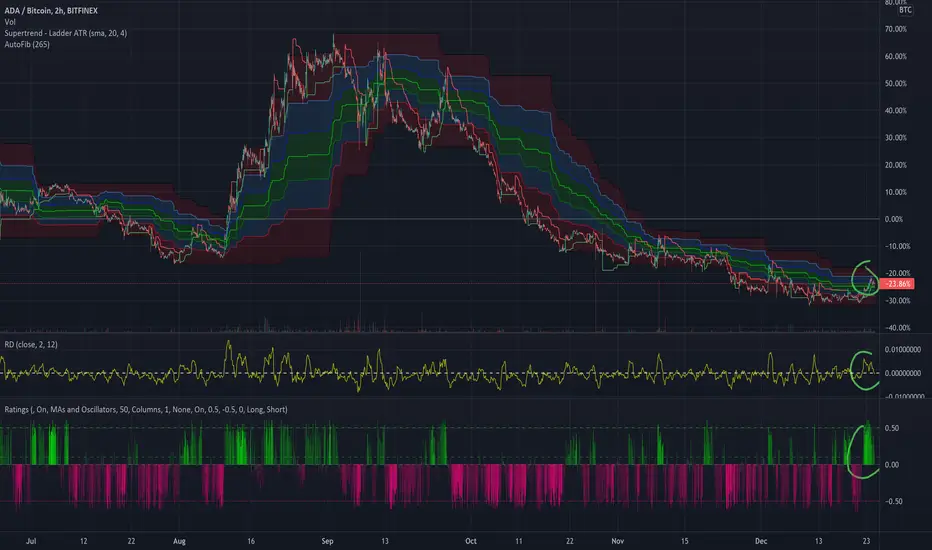
H&S Watch for ADABTC with Consideration of USD IndicatorsI generally don't put much weight on head and shoulder patterns, except for on real low time-frames, but this is a pair value after all.
The base line is clear and the waves show strong adherence to retracement levels. So if the top of the right shoulder is reached with respect to the patterned trajectory then it would be worth checking indicators on ADAUSD to then act accordingly.
Pairs seem to be more self-fulfilling by nature, IMO, and volumetrics on the USD side can be a good source of confirmation.
ADABTC trade ideas

ADA bullrun continuing well past the New Year Eve 2022?Technical indicators showing a change in momentum are broken. This is an updated version of the trend change, at least 4x gains against BTC are expected.
Personally I have tanked ADA with DCA.

#ADA historical #breakouts against #BTCADA may be close to breakout.
Last breakout
1. May 2021
2. August 2021
Is it now December 2021 or later January 2021?

ADA Breakout inevitable, LONGingADA breakout is inevitable, very close. All major technical indicator shows breakout behaviour for ADA.
Last breakout May 2021 and August 2021!
Is it now December 2021?
ADA BTCFor the people who can't sit in this trade yet, wait until one of the scenarios plays out.
I have to say I don't expect fireworks from ADA anymore, Maybe we wont brake 2 doller this bullrun anymore but a run of 30% -%40 is in it.

$ADA Bottom Notification!Weekly Support formed for the last 2 weeks.
Not quite at the bottom of the Linear Regression which suggests maybe more downside, but heavily below the Linear Regression,
This coin has hurt alot of people, Should the bleeding stop now?


ADA will going to complete wave B ADA will going to complete wave B and after that will drop again to complete wave C

ADA monthly chart can we have cup and handle#ADA/BTC
ADA price is at 0.618 fib level of whole swing high.
if price hold this level as support, it will head up to resistance zone around 4000sats.
if bulls success to break out from this resistance price can increase to 8460sats and maybe 12060sats in long term.
but if bears success to reject the price from resistance zone, it will drop to 1656sats that is the 0.786 fib level.


ADA/USD & BTC: POTENTIAL Exhaustion of Supply in Couple of DaysHi Everyone! In order for us to see a CHANCE for reversal to sustained upward pressure, we need the ADABTC pair to show clear sign of EXHAUSTION of supply. We have a CHANCE for this when we have a look at the NEXT 5-Day candle; to begin in another 1-Day and 15-hours. Looks like we still have downward pressure for a bit longer until we see the next 5-Day and 4-Day candle begin in approximately 1-Day and 15-hours.
If BTCUSD has another episode of downward pressure again, we can anticipate ADAUSD and ADABTC to follow suit most likely. We're not out of the woods just yet. Let's see what the NEXT 4-Day and 5-Day candles look like. We don't know what we don't know UNTIL we know it!
Happy Trading and Stay Awesome!


Cardano Hints At Growing vs BitcoinWe have a strong green candle today on the ADABTC pair.
This candle just happen to show up at the same level which worked as resistance back in May before prices peaked.
This candle is also pushing prices above EMA10 and EMA21 in just one hit.
This can be good if today Cardano (ADABTC) closes above 0.00003000. But if it moves back down, it can just be a short bounce before additional drop.
The volume has been low and the correction long.
It is possible to see a reversal here, the conditions are there.
The rest is for the market to decide.
Namaste.

ADA/BTCThe chart shows Cardano 'TO bitcoin, which responds well to the drawn trends. If the currency breaks the long-term downtrend line of this currency, we can expect a good profit.
As it turned out, the failure of the downtrend in the RSI occurred.

Cardano Coin on its strategic supportHi my friends
*****************
The Cardano coin has gained significant support in its correction process after a great flight.
My idea is that if the volume trend increases, we can hope for the end of the ADA reform in the coming days
Appropriate entry points, goals and stops are marked on the chart
************************************************************************************************************************************
If you liked this idea, thank you for liking and commenting
************************************************************************
Be rich and generous
**************************

Ada breakoutDowntrend on D and W, 89days
26day Consolidation, oct 27-nov 22 before continuing down
Daily Time Frame:
Looks like price bounced off a prev s/r level around 2730
Confirmed prev. s/r @2731 (small support on may8-9. small resistance. feb26)
Possible resistance spotted around 3200
Resistance confirmed @3227 with FibR Confluence @ .618 which also acted as a recent support and resistance during a Consolidation phase lasting 25 days between Oct 27 and Nov21
Recent FibR Support @ .5 (nov22) and @ .382 (Nov23) which could act as possible future resistance levels
Reaction to FibR Support @ .236 and prev support @2731 (May8-9) with confluence
Possible resistance spotted @.5fibR, 2815 and a Spinning Top bounce off 2731 prev. support line
Confirmed with previous support (may 10) and prev resistance (Feb26)
Currently below the previously proposed resistance @2815 and moving up to test, Waiting to see if it closes above @2815
4hr Time Frame:
@2731 Support holds on shorter time frame. May 8-9 support invalidated. Feb 26th Resistance holds. Confluence @.236,2729. Confluence @.382,2778 with resistance @.5,2815
S/R @2874 fibR @.236 holds
Inverted Hammer(s) noticed on the 4hr right above @2731 support
Under-bought on the Inverted Hammer @36rsi
No 4hr RSI Divergence observed
Wick cross above 20EMA resistance. Currently @.382,2778
Decision:
Waiting for Dclose over ps/r @2810 or 4hrclose @.5,2815 before going Long
If it closes below @.382,2776 then short
Notes:
Hangman 8 days ago with bearish Divergence
Short term trend reversal (7days) before continuing down with Macro Downward trend

Cardano / Bitcoin The Cardano ecosystem is being built as we witness a macro economic environment that is starved for technology and inflation hedges. New stock industries. New asset classes. Everything goes up, Meaning technology is not high on the checklist for investment. But in the long run, despite pump and dump markting schemes, only solid technology will survive bitcoin's volatility. Right now it's the best time to buy cardano. The most decentralized, most secure programming language, governance system, fairest token distribution, scientific approach to development. Top layer 1 blockchain with an ecosystem of Dapps and companies being built. Buy before the green candles start. Not after. Q1 2022 will be Cardano moment. Outperforming bitcoin and many other tokens.

Cardano ADA looking one more time bullish on the weeklyCardano ADA might start having a bullish reversal on the ADA/BTC weekly. Very soon Cardano dApps will start working on the Cardano mainnet and this will affect the ADA price action in a great deal. One of the first dApps might be SundaeSwap: Cardano DEX, and then after this release many other dApps will be released, making the ADA price action very bullish.

adabtc hitting fibo levelas you see cardano was falling during past days now if you take a look at adabtc chart in daily time frame you see a rejection from golden ratio of fibo and also a positive divergence in rsi
i think it is a good place to go long on ada
this is not a signal by the way
have a nice time

Beautiful bullish divergence in the ADABTC 1D ChartNot convinced whether this matters, but divergence in the ADABTC chart is perfect. Oversold, then retest oversold while ratio makes new lows. This would suggest strong buying opportunity in the paid.

Cardano running out of steamI've been watching BINANCE:ADABTC for a while now. The coin has been trading below its 200EMA, and below the 50EMA, basically a solid down trend. However, there was a support level there, it was possible the the price could find support at that level. As of writing, BINANCE:ADABTC price has broken below that level. I wouldn't want to have that coin in my portfolio at the moment.

ADA/BTC: Entry opportunity after break out of falling wedgeThe ADA / BTC price came back down to test the upper line of the falling wedge, after breaking out of this wedge. This brings an opportunity for entry, to ride the next wave to the upside.
Disclaimer:
I am not a proffesional trader or investor. I post my ideas and analysis for fun only. This is not financial advice.
