ADA $0.30 supportNotice the support/resistance flip ADA has shown at $0.30
Notice the daily upwards trendline.
I believe ADA will breakout bullish above this consolidation period very soon.
I believe the next impulse in ADA will have a minimum target of at least $0.47
Good Luck
ADAUSD.P trade ideas

03/08 - ADAThis is just a small technical analysis for ADA.
Is really simple, using trend lines and S/R.
I believe based on the volume. Price is going up and volume is increasing, a strong indication for a s reversal move to the upside. My trade will be on that break of the smaller trend line with the target being a Holding Level or the other trend line above.

✴️ Cardano's Party Starts Now | New High In Sight!The retrace is over... It is a retrace because the price drop only lasted a few days and remains within a higher low compared to the last major low 10-June.
I am talking about Cardano (ADAUSD) of course.
Yesterday closed as a bullish hammer, the same we had on the Bitcoin and Ethereum charts.
This hammer here is supported by a strong MACD, above zero and a bullish RSI, above 50.
The blue trendline on the chart shows the higher lows.
Notice that there aren't many indicators nor complicated explanations... None of that is needed to read a chart, no complexity is needed to predict the future in fact, simple is best.
If you can't explain it simple enough, it means you might not be as knowledgeable in the subject as you initially thought.
This is valid for everything.
If you can explain something in a calm and simple manner, it shows that you understand.
I am not saying this to criticize or point out others peoples mistakes, I use it on myself.
✔️ You can analyze yourself and see how you feel when doing an analysis, or when opening up a trade.
If the feeling is serene and the signals are good, everything is ok.
If the feeling is of excitement, hurry, making money and rush, stop for a minute because whatever you are doing might be wrong.
Prices move up and down, this we know for sure.
Cardano moved down from April until June, it can now easily go up.
We can setup a stop-loss or define/share an invalidation point, but my readers are experienced, most of them, you have experience... My job is to alert you before things move.
Your job is to use this information to take action, remove doubts, improve your results.
This is not financial advice.
Thanks a lot for your support.
Namaste.

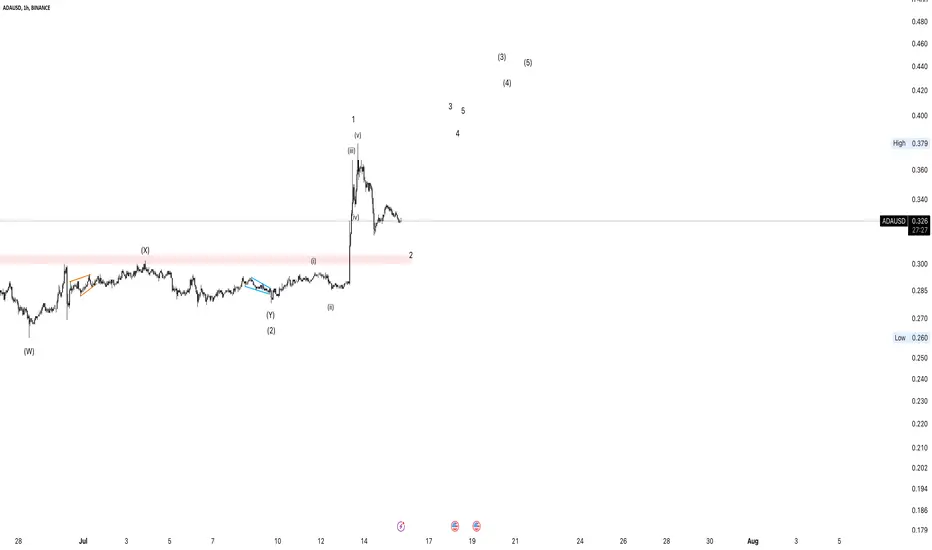
Cardano Update: Shorterm Micro Bullish Structure Intact......But this could be extended wave 4 in an overall c-wave decline displayed in purple. The mid June decline into the low .20 cent region invalidated the immediate move to the $.70-.80 level. Granted in the very micro charts, the structure favors higher levels...but it may just be respite for eventual lower levels to come.
Black is my primary analysis and purple and orange are alternative pathways. However purple has a high probability of completing. If price were to breach $0.47 at any time, I will defer to my orange pathway.

ADAUSD-Trade in rangeADAUSD is trading in range between support and resistance placed buy limit at S1 and Sell limit at R!

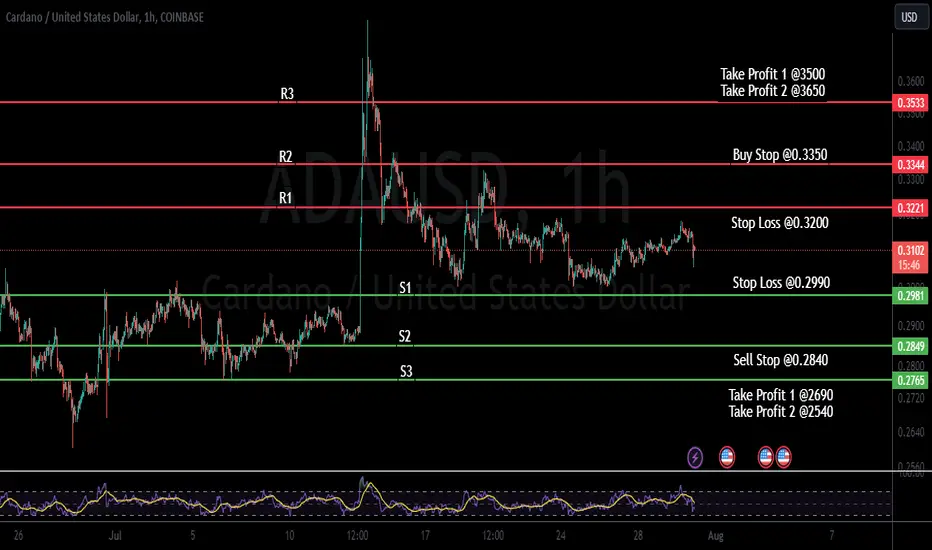
ADAUSD Sideways Trend 1 HourADAUSD show a sideway trend. That's why we use Support and Resistance for trading in Sideway Market. We pointed 3 Supports and 3 Resistance for our trading plan.
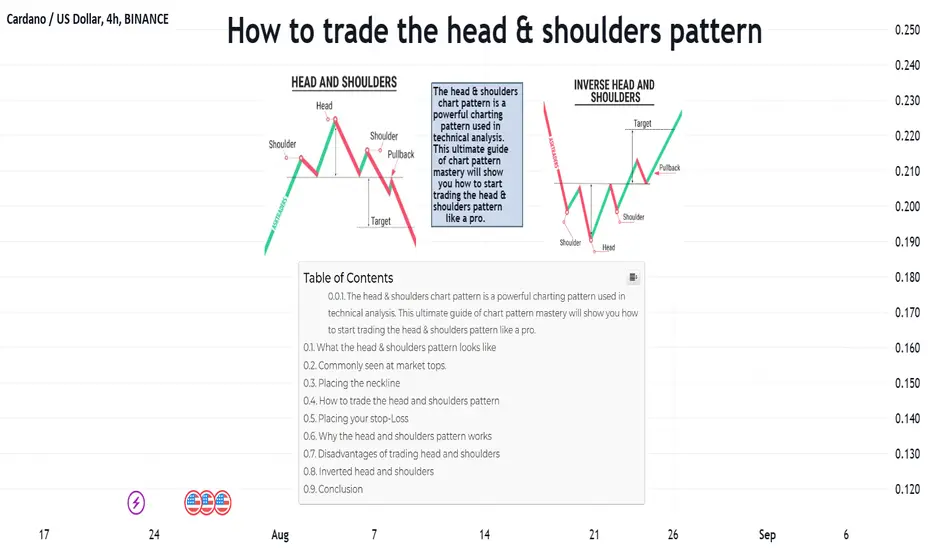
How To Trade The Head & Shoulders PatternThe Head & Shoulders is an extremely popular and easy to spot chart pattern used in technical analysis. After you read this guide you will know exactly what to look out for whilst trading. The pattern appears on all times frames and can, therefore, be used by day and swing traders as well as investors. Entry levels, stop levels and price targets make this trading formation easy to implement, as the chart pattern provides important and easy-to-see levels.
First, let’s look at the formation of the head and shoulders pattern:
Formation of the pattern:
Left shoulder: Price rise followed by a left price peak, followed by a decline.
Head: Price rise again forming a higher peak.
Right shoulder: A decline occurs once again, followed by a rise forming the right peak which is lower than the head.
As you can see from the image above, it is very similar to the triple top, however the peaks are of different heights and the neckline is not strictly horizontal.
A head and shoulders pattern is formed first by a peak (the shoulder) followed by a higher peak (the head) followed by another lower peak (the second shoulder).
In this instance, we draw the neckline by connecting the two lowest points that are visible from the pullbacks. More often than not the line will not be straight, but don’t worry this is typical for a head and shoulders pattern.
PLACING THE NECKLINE
The first step is to locate the left shoulder, head and right shoulder on the chart. In the standard head and shoulders pattern (market top), we connect the low after the left shoulder with the low created after the head. This creates our “neckline” – the blue dashed line on the example.
HOW TO TRADE THE HEAD & SHOULDER PATTERN
So how do we trade this? Well, we use the exact same method as the triple top and double top. Simply wait for a clean break of the neckline and then enter our SELL positions. We can expect a pullback to be a similar distance to the difference between the head and the neckline.
Tip: Some traders say that the signal is more accurate when then neckline is a downslope. This would signify that the market is clearly losing strength and the possibility of a clean break of the neckline is more likely.
Chart pattern formations are rarely textbook perfect, meaning there may be some discrepancies between the respective shoulders and head.
It is very important that traders wait for the pattern to complete. One should not assume that a pattern will develop or that a partially developed pattern will become complete in the future. Partial or nearly completed patterns should be watched, but no trades should be made until the pattern breaks the neckline.
In the head and shoulders pattern, we are waiting for price action to move lower than the neckline after the peak of the right shoulder. For the inverse head and shoulders, we wait for price movement above the neckline after the right shoulder is formed.
A trade can be initiated as the pattern completes. Plan the trade beforehand, writing down the entry, stops and profit targets and noting any variables that will change your stop or profit target. The most common entry is when a breakout occurs – the neckline is broken and a trade is taken. Another entry point requires more patience and comes with the possibility that the move may be missed altogether. This method involves waiting for a pullback to the neckline after a breakout has already occurred. This is more conservative in that we can see if the pullback stops and the original breakout direction resumes, but it also means the trade may be missed if the price keeps moving in the breakout direction.
PLACING YOUR STOP-LOSE
In the traditional market top pattern, the stop-loss is placed just above the right shoulder (topping pattern) after the neckline is penetrated. As a break above this point is usually where the pattern becomes invalidated. Alternatively, the head of the pattern can be used as a stop, but this is likely a much larger risk and reducing the reward to risk to reward ratio of the pattern.
WHY THE HEAD & SHOULDER PATTERNS WORKS
No pattern is perfect, nor does it work every time. Yet there are several reasons why the chart pattern theoretically works:
As price falls from the market high (head), sellers have begun to enter the market and there is less aggressive buying.
As the neckline is approached, many people who bought in the final wave higher or bought on the rally in the right shoulder are now proven wrong and facing large losses – it is this large group that will now exit positions, driving the price toward the profit target.
The stop above the right shoulder is logical because the trend has shifted downwards – the right shoulder is a lower high than the head – and therefore the right shoulder is unlikely to be broken until an uptrend resumes.
The profit target assumes that those who are wrong or purchased the security at a poor time will be forced to exit their positions, thus creating a reversal of similar magnitude to the topping pattern that just occurred.
The neckline is the point at which many traders are experiencing pain and will be forced to exit positions, thus pushing the price toward the price target.
Volume can be watched as well. During inverse head and shoulder patterns (market bottoms), we would ideally like the volume to expand as a breakout occurs. This shows increased buying interest that will move price toward the target. The decreasing volume shows a lack of interest in the upside move and warrants some scepticism.
DISADVANTAGE OF TRADING HEAD & SHOULDER PATTERN
As stated, no trading pattern is perfect. Here are some potential problems with trading a Head and Shoulders pattern:
You need to find patterns and watch them develop, but you should not trade this strategy until the pattern is completed. So it could mean a long period of waiting.
It will not work all the time. During times of high volatility, the stop-loss levels will sometimes be hit.
The profit target will not always be reached, so traders may wish to fine-tune how the market variables will affect their exit from the security.
The pattern is not always tradable. For example, if there is a massive drop on one of the shoulders due to an unpredictable event, then the calculated price targets will likely not be hit.
Patterns can be subjective. One trader may see a shoulder, where another does not. When trading patterns, define what constitutes a pattern for you beforehand – given the general guidelines above.
INVERTED HEAD & SHOULDER PATTERN
As with most of these patterns, there is always a mirror pattern that works in the exact same way. Here is an example of an inverted head and shoulders pattern.
As you would expect, the inverted head and shoulders pattern only arises in a downtrend and must meet all of the same criteria as the standard head and shoulders pattern.
We simply place a LONG once there is a clear break of the neckline and the trend reversal is confirmed.
CONCLUSION
Head and shoulder patterns occur on all times-frames, and can be easily seen visually. While subjective at times, the complete pattern provides entries, stops and profit targets, making it easy to implement a trading strategy. The pattern is composed of a left shoulder, head, then followed by a right shoulder.
The most common entry point is a breakout of the neckline, with a stop above (market top) or below (market bottom) the right shoulder. The profit target is the difference of the high and low with the pattern added (market bottom) or subtracted (market top) from the breakout price. The system is not perfect, but it does provide a method of trading the markets based on logical price movements. (Profit-taking opportunities abound using this lesser-known pattern.
ADA chart Ada is a good and safe but low-profit currency for investment.
7$ to 9$ is Ada price target until the mid of 2025.

ADA IntradayHi
It seems that ADA is making another 1,2 wave
for its wave 3 and so is progressing ahead.
I recommend to wait and see if it can make a five waves up
and next correction to get in ADA.
Free link of ADA:
www.tradingview.com
Thanks

Cardano updateMaybe it was a good level for cashing in some profits at the purple rectangle. This drawing still seems too crowded compared to other exercises but there might still be some surprises left waiting for us in the future.
I added a vertical line at the center of the circle because I am interested in what happens near the circle or in the vicinity of it's time projection.

Rumble in the JungleThis is just another experiment. A little bit crowded with the shapes but I had no other choice. Let's see where this ends up. up. up. These shapes used to be support, resistance or retracement areas, but they slowly shifted into projections.

ADA short For more context on the broad crypto short, see:
Ada rejected off the 76 retracement and now under the 61. Shorting betting we do not break the 76 again.
Short ADA 0.32
Stop 0.38
Target 0.13

ADA intraday chartHi
It seems that ADA is moving a head of BTC and last week
strongly broke out its red resistance zone and now is pulling back
on its upper side.
This pull back looks like another impulse wave and can
be wave 1 and 2 of wave minor of wave 3 intermediate but
I guess it is better to give more time to show its bullish strength
in the next week.
I am waiting to see its reversal and count another 5 waves bullish
to confirm it is perfectly in the bullish rally.
Thanks
Bye
ADA long term targetAs the TVL in DeFi continues to grow, ADA could possibly hit the FIB targets again like last cycle.

Beginning on the new bull runPrice has clearly shown what it's direction and destination is. So I say hop on for the ride.

Cardano ADA
After the breakout of 330 support and confirmation as resistance, I expect an eagle attack and continuation into the nest.
Only if a close above the resistance is valid can it invalidate this idea.


ADAUSD crossed over the MA200 (1d). Buy signal.ADAUSD crossed over the MA200 (1d) after 5 weeks under it.
The main pattern is a Channel Down and the last time the MA200 broke after a bottom, made the price peak near the 1.382 Fibonacci level.
Trading Plan:
1. Buy on the current market price.
Targets:
1. 0.44000 (under the MA200 1d).
Tips:
1. The RSI (1d) is overbought. The other two times it reached that level this year, one was at the start of an uptrend (straight after crossing above the MA50 1d) and the other at the end of the uptrend (but the MA50 1d has been broken much earlier). This time the MA50 (1d) just broke today, so it is more likely that we are still at the start of the uptrend.
Please like, follow and comment!!

✴️ Cardano 8X Leverage Full Numbers (Adults Only)Full numbers for the ADAUSD/ADAUSDT trading pair.
===
LONG ADAUSD
Leverage: 8X
Buy-in: $0.275 - $0.291
Targets:
1) $0.311
2) $0.350
3) $0.383
4) $0.444
5) $0.480
6) $0.551
7) $0.595
8) $0.652
Stop-loss: Close daily below $0.270
Potential profits: 1008%
Capital allocation: 3%
===
This is not financial advice.
Remember leveraged trading is high risk and for experienced traders only.
Trade at your own risk.
Namaste.

ADAUSD (Daily) - Bullish reversalHi Traders
ADAUSD (Daily Timeframe)
Waiting for the upward break of 0.305 resistance level, which will complete a bullish trend reversal pattern to go LONG. Only the downward break of 0.262 would cancel the bullish scenario.
Trade details
Entry: 0.305
Stop loss: 0.262
Take profit 1: 0.331
Take profit 2: 0.373
Score: 5
Strategy: Bullish reversal

Cardano to 80 cents by 2024- We may be engaged inside the start of a W3 right now and could experience massive gains if this is to be the W3 drawn out. If this is to be true then we have finished W2 and need confirmation of a breakout above W1 to confirm we are in a W3.

Cardano looking risky- Cardano must break above the resistance of this channel or it is doomed. Where I have drawn the circle is where the resistance of the bottom of the channel is it at with price. We tried twice to break above it and since then loss momentum and turning over. It is a matter of time of when this thing breaks down.

ADA price touching supportCardano ADA is one more time touching support on the monthly after a few years. Cardano fundamentals and DEFI are growing stronger every day and Cardano TVL is getting closer to the 600 million ADA ATH mark. Very soon the ADA bull market will be confirmed.
