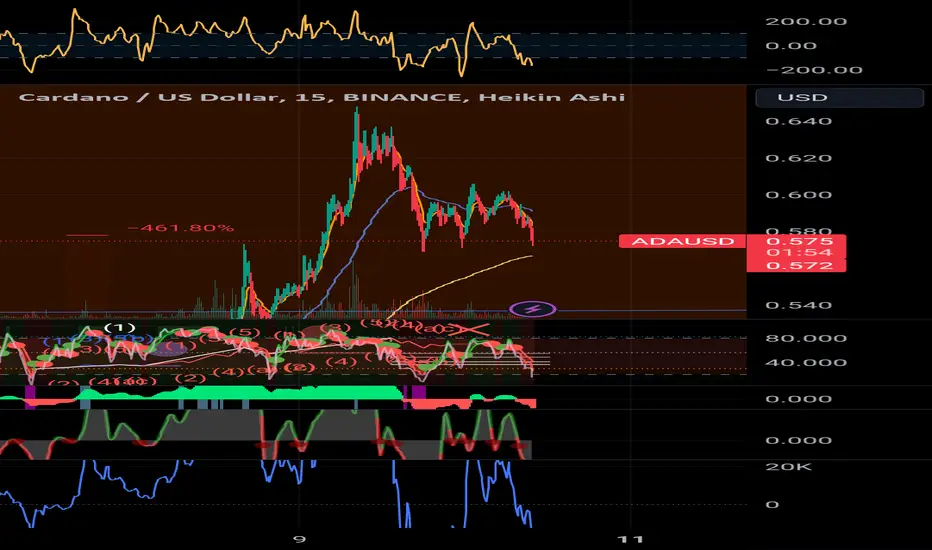
Whale Activity Boosts ADA, Eyes $0.70 Breakout!A significant increase in whale activity with transactions worth $1.5 billion in the last 24 hours has led to a 15% surge in ADA's price.
Crossing the $0.60 Barrier: ADA's uptrend continues to strengthen as it crosses the $0.60 mark.
Potential to Reach $1: If the bullish trend crosses $0.70, Cardano could reclaim the important psychological level of $1.
Mimicking Bitcoin's Rise: ADA's price jump follows a positive trend in Bitcoin, with a 3.45% rise recently.
17-Month High Achievement: Cardano achieves a 17-month high with a notable 72.61% increase over the last 14 days.
Market Cap Nearing $23 Billion: Cardano's market cap is approaching $23 billion, indicating a robust recovery mode.
Golden Crossover Possibility in Weekly Chart: The ongoing bull run may lead to a golden crossover in the weekly chart.
Current Trading Price: ADA is trading around $0.60, with the potential to break higher levels.
Technical Indicator - MACD: The MACD shows a positive trajectory, indicating growing underlying demand.
On-Chain Data Insights: Intotheblock’s analysis reveals a spike in large transactions, highlighting increased interest from whales.
In/Out of the Money Indicator: The Global In/Out Of The Money (GIOM) indicator suggests ADA is entering a crucial zone between $0.64 and $0.84.
Wallet Addresses Profitability: Approximately 58% of ADA wallet addresses are currently profitable following the price surge.
ADAUSD.PM trade ideas

🐋 Deep Dive Part II: Whale Behavior & Market Mastery! 🌊📚Hey Crypto Enthusiasts! 🚀
In a recent analysis, I not only nailed Bitcoin's (BTC) movement but also illuminated the subsequent altcoin surge, driven by insightful whale behavior observations. Let's merge these insights with a focus on ADA (Cardano), OP (Optimism), SOL (Solana), and BTC. 📊
Cardano's (ADA) Meteoric Rise 🌟
ADA's journey began with a break above a pivotal support-resistance level. My entry point at 0.256 turned into a remarkable rally, hitting 52 cents. This movement was a classic case of altcoin buoyancy following Bitcoin's pause.
Optimism (OP) and the Altcoin Breakouts 🌈
In the shadow of Bitcoin's stagnation, altcoins like OP exhibited significant breakouts, showcasing the shifting focus of market whales from Bitcoin to promising altcoins.
Bitcoin (BTC) and Whale Dynamics 📉
Bitcoin's behavior provided a crystal ball into the whale activities. As BTC approached a major resistance level, it signaled a strategic move by whales to divert funds towards altcoins, catalyzing their surge.
Solana (SOL) and Market Trends ☀️
Solana's chart also mirrored this trend, highlighting the broader market dynamics influenced by these significant players.
🔍 Insight on Whale Behavior:
My analysis delved deep into the whale behavior, highlighting how Bitcoin's rally and subsequent pause was a precursor to altcoin dominance. This strategic pause in Bitcoin's ascent was a clear signal for the whales to redistribute their focus and capital, sparking a remarkable rise in altcoins like ADA, OP, and SOL. 🔄
The Bigger Picture - Understanding Market Shifts: What this trend teaches us is the importance of reading between the lines. Whale movements often precede major market shifts, and by understanding these patterns, we position ourselves to make informed decisions. 🧠
Future Outlook: As we continue to monitor these market dynamics, it's crucial to stay vigilant. The crypto market is known for its volatility, and while the current trend favors altcoins, it's essential to be prepared for any shifts that may arise. Always keep an eye on key resistance and support levels, market sentiment, and global economic factors that could influence the next big move. 🌐
Together, let's stay ahead of the curve in this fascinating and ever-evolving world of cryptocurrency. Your insights and engagement are what make this journey exciting and rewarding!
One Love,
The FXPROFESSOR 💙
part 1:

Cardano TO OLD ATH in 2024? This move is very similar to the previous price action for ADA. We also had a test on the bottom three times. If ADA can turn this resistance into support. My expectation is that we are heading towards the old ATH.

ADA → Cardano Coming Down! Where Will We Land? Let's Answer.Cardano had a fantastic measured move event from the breakout point on October 23rd, a move that I overlooked in my last couple of analysis! The price shot up from $0.27 to $0.41, pulling back into a bull flag, then ripping up from $0.41 to $0.62! Now that the move is complete, where do we go from here?
How do we trade this? 🤔
The measured move is usually followed by a trading range, which can turn into a continuation pattern over time *OR* a reversal to the downside. We need more price action to determine the next moves. Right now we have a market that is burning hot on the upside, and RSI that is over 70.00, and the massive bear candle from last night that showed the bulls taking profits at this key level.
Right now, we need more price action to justify an entry. Given the current datapoints, we should expect some sideways price action until the 30EMA catches up, but its likely we'll fall down toward the previous Resistance Zone that may not act as support. The test of that zone will give us strong evidence as to the next moves for Cardano. We need to see a strong bull signal and confirmation bar to justify a long. An RSI level of 50.00 or below would be ideal as well.
Until then, it's reasonable to stay on the sidelines until more price action plays out.
💡 Trade Idea 💡
Long Entry: 0.482
🟥 Stop Loss: $0.437
✅ Take Profit: $0.572
⚖️ Risk/Reward Ratio: 1:2
🔑 Key Takeaways 🔑
1. Measured Move Complete! Trading Range or Reversal Likely.
2. Previous Resistance Needs to be tested as Support.
3. If Support Holds, Could go up for another test of the Previous High.
4. If Support Fails, Expected Lower Lows around 200EMA.
5. RSI at 70.00, Above Moving Average. Bias for Short-Term Short.
⚠️ Risk Warning! ⚠️
Past performance is not necessarily indicative of future results. You are solely responsible for your trades. Trade at your own risk!
Like 👍 and comment if you found this analysis useful!

ADA bigger flag formation? take two :)Lets try again. This time the trade is active allready. Anything can happen. Set that stop loss..
*** not financial advice DYOR ***

Cardano Beware of rising price action for altcoins. That upward price action draws you into the market. These types of rallies are often followed by another pullback.

Cardano Flag formationLets see how this plays out. First price needs to brake out above upperline. Then wait for retest to buy.
***Not financial advice DYOR***

i think there is a bull flag i think there is a bull flag guys.. please look at carefully target 0.78

Ada I just picked up moreMy idea leads me to a $3.20 to $8
I hold a bunch already and if I see signs os a super cycle it will be closer to $12. We will know about that in 1-2 weeks.
NOT FINANCIAL ADVICE
Cardano - Bullrun incoming?🚀 With cryptocurrencies now in the spotlight, they've captured my attention as well. I've refreshed my chart; I hope you like the new look.
Now, back to Cardano. Cardano is showing weakness in Wave 3, and I believe we'll soon witness Wave 4 before proceeding with Wave 5. Wave A should now be forming at the 23.6% Fibonacci Retracement. Then comes Wave B—exact levels are still unclear. However, Wave C or Wave 4 should follow. Once I pinpoint the location of Wave B, I'll provide more details and send out a limit order for Wave C or Wave 4. Wave 4 is our entry zone. 📈💫

ADA LONG. BOUNCE OFF THE PULLBACKI like ADA. I'm personally long on it long term anyway. Its had a massive move in the last 24 hours. some might say because it broke through the strong 0.4 resistance level that was previously support. Will it pull back and see 0.4 support again? I'll go in leveraged 3% of account value at 30x. may take a week or two to execute. may never come back that low. who knows

ADA wait for entry
ADA has been consolidating above the long-term trendline. It's about to break the ascending triangle.
The proposed trade is activated if the resistance (of the triangle) is broken.
For long-term trade of ADA, please refer to link below.
1W chart of ADA
Disclaimer:
This analysis is based on my personnal views and is not a financial advice. Risk is under your control.


ADAUSD: Buying not over yet.Cardano has turned overbought on the 1W timeframe (RSI = 79.294, MACD = 0.031, ADX = 45.270) being on the strongest weekly candle since the previous Bull Cycle and the August 9th 2021 week. Despite that, the market doesn't seem to be done buying as the pattern is an Ascending Triangle whose HH top is exactly on the 1D MA200. Those two along with the R2 level (0.6865) of the May 30th 2022 High make a Triple Resistance Zone. Consequently, if the R1 level is crossed, we will buy the breakout and target just under this Triple R Zone (TP = 0.67500). After that, the market may seek potentially a technical relief pullback to at least the 0.236 Fibonacci level.
## If you like our free content follow our profile to get more daily ideas. ##
## Comments and likes are greatly appreciated. ##

ADA December Outlook Price targets of ADA for December.
We have broken out of the threshold range and are approaching PH2.
PL1 is is the bottom of the threshold range and thus has been omitted.
I have been long on ADA for a couple months and continue to be. Looking for a move to PH2 and will see.
If we see rejection, we likely will come to the threshold range and bounce again.
Else we may see some consolidation in this area and a continuation to the top of the range.
Not advice,
Safe trades!

ADA → Cardano Racing Toward Resistance! Will We Reverse!?Cardano is racing toward the Resistance Zone after a successful break to the upside from last week's bull flag, as predicted in our last analysis. We're getting closer to resistance and the big question is, do we short it?
How do we trade this? 🤔
If you're still in a long from bull flag breakout, good! Don't exit yet as we have not seen a reversal signal. ADA likely will make it to $0.45, I would take profits around that price area. Once we hit the resistance zone it's reasonable to expect a pullback or even a reversal. If we get a bear signal bar followed by a confirmation bar closing on or near its low, it's reasonable to short.
We are in a bullish macro trend, so a short would be playing the reversal where Probability is low, but Risk/Reward is over 1:2. I would take half profits at 1:1 around $0.422, move the stop loss up to your entry price and swing the rest until we see the reversal bar to the upside.
💡 Trade Idea 💡
Short Entry: $0.446
🟥 Stop Loss: $0.468
✅ Take Profit #1: $0.422
✅ Take Profit #2: $0.403
⚖️ Risk/Reward Ratio: 1:2
🔑 Key Takeaways 🔑
1. Bull Breakout of 200EMA Followed by Bull Run.
2. Bull Flag Continuation Pattern Playing Out.
3. Resistance Zone Approaching, Look for Sell Signal.
4. Do Not Short Until Sell Signal and Bear Confirmation Candle Close.
5. RSI at 65.00, Above Moving Average. More Up Before Down.
⚠️ Risk Warning! ⚠️
Past performance is not necessarily indicative of future results. You are solely responsible for your trades. Trade at your own risk!
Like 👍 and comment if you found this analysis useful!

ADA Ascending triangleWaiting patiently for breakout and confirmation. Buy when price bounces up on topline, this would be confirmation of the breakout. Everthing is in the chart..

ADA // Key idea Key Idea
Possible Bearish Harmonic Wave if we get strong rejection at the GP
Looks bullish if the level is crossed around $0.45
Major Analysis is bull for a LT persceptive only if the $0.45 or $0.68 are the new supports

adausdtSupport and press the rocket to cheer me up
Observe the ten percent loss limit
Stay away from Bitcoins
Feel free to buy and sell and post your comments

ADA Weekly double bottom supportADA forming a weekly double bottom with target being 2018 ATH at ~.98 cents.

Cardano is in an uptrend rallyHello there!
I am a big fan of the Elliott Wave Principle, which is very interesting and useful for analyzing the market. I have developed my analytical approach by combining the principle with my personal experience and considering various scenarios that may occur in the market.
Although I want to share my analysis with you, I want to emphasize that I do not provide buy or sell signals. My main intention is to share my unbiased analysis so that you can use it as a guide to make informed decisions.
To build your confidence in my analysis, I always share my previous analysis of the same market so that you can compare and see the progress. All the details of my analysis are clearly labeled, which should make it easy for you to understand.
I hope that my analysis will be helpful in your trading journey and wish you all the best.
Sincerely,

ADA ShortCheck comments in Trade, thanks. I have Cardano in a short position here pending the break of the neckline down or invalidation of the Head and Shoulders Pattern R.

$ada Cardano ready to breakout of accumulation Any day now LSE:ADA will breakout of over a year of accumulation. It is one of the few coins that haven't seen a significant rally as of yet. That is about to change in my opinion. A conservative price target would be $1.05ish where the 77 Vwma currently sits. A 155% gain. A timeframe on this would be about 2 months to target.
