Cardano, The Support Line —Crypto For The FutureHere we have Cardano long-term. I am keeping it simple because simple is best.
We have this "support line." Notice that a descending wave ends on a flat support. Each time this pattern showed up, decreasing prices with a stable base, what followed was a strong inverse reaction. Prices were going down but the reaction was a strong jump. Notice how each time the bullish jump becomes bigger.
» The first support line and descending triangle happened in 2023. This led to a small bullish wave, not a fast one but a good one.
» The second descending triangle and support line happened in 2024 and this one led to a strong bullish jump supported by high volume. Here the candles start to become bigger.
» The third and final support line is the current one, 2025. This one is expected to produce such a strong reaction that a new all-time high is expected and beyond.
Now, the action will be wild and strong but it won't happen in a single day, week or month, it will take months, many months. The bullish wave can develop in 4 months as it can take 6 months or even more. And this even more is very important because this is something not seen before. A "White Swan" event. The bullish cycle can develop for 12 months or even more because the preparation has been so prolonged and because fundamental market conditions have been improving for years, with a major boost the past 6 months. Conditions are so much better now compared to just a few years ago, that it is even hard to understand. It is like the world is shifting, changing and adapting to our vision. We saw Crypto, we voted for Crypto with our energy, attention and money, and the world is now catching up.
If all this "improvement" in acceptance and adoption has already happened within just 6 months, what do you think will happen in four full years? By the time this cycle is over, we will be living in a different world.
If you are in this market now, Oh boy! you are blessed; you are wise, you made the right choice.
If you are a developer, a reporter, a coder, designer, web manager, project owner, entrepreneur, promoter, innovator and the like, you are damn smart and you will be reward for the risk you took.
If you are on the other side of the spectrum, the artist, the dancer, the writer, the composer, the teacher, the athlete, the body builder, yoga instructor, waiter, the server, the clerk; the lawyer, the accountant, the advisor, and decided to put your hard earned money in Crypto, you decided to join... God bless you, you will be rewarded for the risk you took.
Patience is key, we are very close.
If you decided to trust my clean-sharp-straight words, Thank you!
You are appreciated greatly for your continued support.
If you are a human being, we love you... Crypto was made for all of us.
Don't worry about Cardano, it is going up.
Namaste.
ADAUSDT trade ideas

ADA Long Swing Setup –Support Holding, Watching for Retest EntryADA has held the $0.50 support level over the past few weeks. If price retraces into the $0.53–$0.55 zone, we’ll be looking to enter a long spot trade from support for potential upside continuation.
📌 Trade Setup:
• Entry Zone: $0.53 – $0.55
• Take Profit Targets:
o 🥇 $0.64 – $0.66
o 🥈 $0.71 – $0.75
o 🥉 $0.80 – $0.84
• Stop Loss: Daily close below $0.51

ADA About to Explode or Fakeout Trap?Yello Paradisers — is ADA quietly setting up for a powerful reversal, or are we about to walk straight into a painful bull trap? This zone could decide everything, and here’s why you need to pay close attention.
💎Cardano (ADAUSDT) is currently sitting right on the supportive trendline of a descending channel, while also forming a classic double bottom pattern. What makes this even more significant is the presence of bullish divergence on RSI. This combination alone already hints at a potential bullish reversal, but there’s more to it.
💎The current zone also served as a previous resistance area, and it has now flipped into support—this “resistance-turned-support” structure adds confluence and increases the probability of an upward move. When multiple bullish signals align at a major structural level like this, it usually sets the stage for a strong bounce.
💎Aggressive traders who entered early from current levels are already seeing a potential 1:1 risk-to-reward ratio. However, for safer and more strategic positioning, conservative traders can wait for a pullback to this support zone. Waiting for a bullish confirmation candle after the pullback can offer a better entry with a healthier RR and higher probability of success.
💎That said, if the price breaks below the current support and closes a candle below our invalidation level, the entire bullish idea will be invalidated. In that scenario, the smart move is to remain patient and wait for a new setup to form. Chasing trades after invalidation is how most retail traders get trapped—don’t be one of them.
🎖Strive for consistency, not quick profits. Treat the market as a businessman, not as a gambler. This is the only way you’ll make it far in your crypto trading journey. Be a PRO.
MyCryptoParadise
iFeel the success🌴

Cardano Correction or Opportunity? (READ THE CAPTION)By analyzing the #Cardano chart on the 3-day timeframe, we can see that after reaching 73 cents and amid rising war tensions, the price started a correction along with the broader crypto market. This correction has now brought ADA to attractive zones for potential laddered buying and long-term investment. Cardano is currently trading around 54 cents, and if the conflict continues, it may drop further, possibly below 45 cents.
Key demand zones are at $0.36, $0.45, and $0.52.
Short-term targets are $0.61 and $0.76, while long-term bullish targets are $0.93, $1.05, and $1.33.
Please support me with your likes and comments to motivate me to share more analysis with you and share your opinion about the possible trend of this chart with me !
Best Regards , Arman Shaban

Cardano sell short go 0.23Cardano is ready for a sharp decline, you should take a sell trade with all your might, targets 0.40, 0.30, and 0.20.

It's disappointing !!!Do you think this will happen, or do you see ADA below $0.50 in the future?
Best regards CobraVanguard.💚

ADAUSDT → Bear market. Support breakdownBINANCE:ADAUSDT.P is in the distribution phase after exiting consolidation. The coin continues to update local lows within a downtrend.
Technically, the cryptocurrency market is in stagnation/correction, as there is no bullish driver yet. Bitcoin is currently consolidating but continues to shoot local downward impulses, which generally has a negative impact on coins.
ADA is entering a distribution phase of accumulation formed in the range of 0.62 - 0.71. If the bears keep the price below 0.62-0.6, ADA may well test the intermediate bottom of 0.5364-0.51
Resistance levels: 0.61, 0.62
Support levels: 0.5993, 0.5364
Focus on 0.61 and the local level of 0.5993. Price consolidation below this zone could confirm the bearish nature of the market, which could lead to another decline.
Best regards, R. Linda!

DeGRAM | ADAUSD above the demand zone📊 Technical Analysis
● ADA is testing the confluence of the long-term support line and the 0.54-0.63 demand zone; every prior touch of this area sparked a 20-30 % rebound.
● A falling wedge within the broader descending channel is close to completion; a 16 h close above the wedge roof (~0.66) activates a measured move to the first horizontal resistance at 0.73 and the channel cap near 0.86.
💡 Fundamental Analysis
● The upcoming Chang hard-fork, which introduces on-chain governance and boosts staking utility, is scheduled for main-net in Q3 2025, lifting on-chain activity and TVL.
✨ Summary
Long 0.58-0.63; wedge breakout >0.66 targets 0.73 ➜ 0.86. Bull bias void on a 16 h close below 0.54.
-------------------
Share your opinion in the comments and support the idea with a like. Thanks for your support

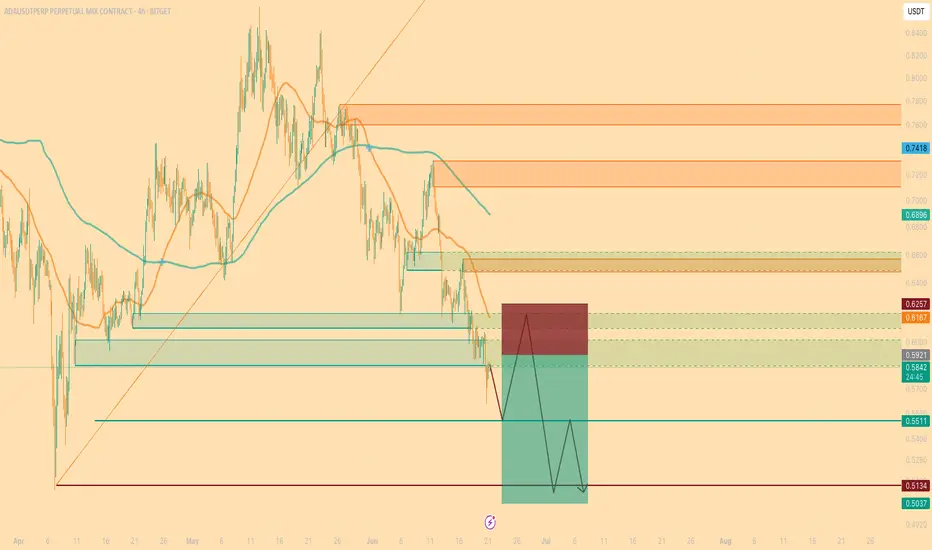
ADA/USDT SHORT SETUP | 4H STRUCTURAL BREAK & LIQUIDITY GRABAfter a confirmed structure break to the downside on the 4H chart, ADA appears to be retracing toward the previous demand zone, now acting as a potential supply/mitigation area.
📌 Idea Overview:
Price is expected to revisit the 0.5921 – 0.6167 range, which aligns with the last broken order block. This retracement would likely serve to collect liquidity above recent highs before a potential continuation to the downside.
📈 Key Technical Insights:
The retracement zone aligns with a former demand area and sits just below a strong resistance at 0.6257.
Confluence: Moving averages, previous imbalance fill, and liquidity resting above prior highs.
Anticipated rejection from this zone could initiate a fresh bearish leg.
📍 Trade Parameters:
Entry Zone: 0.5921 – 0.6167
Stop Loss: Above 0.6257 (4H close confirmation)
Target 1: 0.5511
Target 2: 0.5134
Target 3: 0.5037 (extreme liquidity target)
⚠️ Bias: Bearish
This is a textbook setup combining structure break, order block retest, and liquidity engineering principles. Monitoring price action closely around the retest zone for confirmation.
🧠 "Smart money moves after liquidity – not before."
Cardano Eyes 16% Gain, Main Target Set Firmly At 0.65Hello and greetings to all the crypto enthusiasts, ✌
All previous targets were nailed ✅! Now, let’s dive into a full analysis of the upcoming price potential for Cardano 🔍📈.
📉 Cardano is currently trading inside a descending channel, hovering near a key historical support — the strong daily level at the psychological 0.50 mark. This zone could act as a solid base for a potential bounce.
🚀 I’m targeting at least a 16% upside, with a primary resistance around 0.65.
🧨 Our team's main opinion is: 🧨
Cardano is holding a strong daily support near 0.50 within a down channel, setting up for a potential 16%+ rally toward 0.65. 📈
✨ Need a little love!
We put so much love and time into bringing you useful content & your support truly keeps us going. don’t be shy—drop a comment below. We’d love to hear from you! 💛
Big thanks , Mad Whale 🐋

Cardano Wave Analysis – 23 June 2025- Cardano reversed from the support area
- Likely to rise to resistance level 0.6000
Cardano cryptocurrency recently reversed from the support area between the long-term support level 0.515 (which has been reversing the price from November of 2023) and the lower daily Bollinger Band.
The upward reversal from this support area stopped the C-wave of the earlier weekly ABC correction (B) from the start of May.
Given the strength of the support level 0.515 and the oversold daily Stochastic, Cardano cryptocurrency can be expected to rise to the next resistance level 0.6000.

CardanoAda usdt Daily analysis
Time frame daily
Risk rewards ratio >3 👈👌
Double bottom pattern has been created

Major Move Ahead for ADA – Breakout or Breakdown?
🔍 ADA/USDT Analysis – Dual Scenario Setup (BUY & SELL)
Currently, ADA is ranging between major supply and demand zones. Two clear scenarios are in play depending on how price reacts to key levels:
📈 Bullish Scenario (Long):
Entry: On breakout and confirmation above $0.6027
Target: $0.869 (major resistance zone)
Stop Loss: Below $0.523
Trigger: Break of descending trendline and solid structure above $0.6027
📉 Bearish Scenario (Short):
Entry: Around $0.5120 (rejection from supply zone)
Target: $0.315 (strong demand zone)
Stop Loss: Above $0.6027
Trigger: Failed breakout and rejection from $0.5120 level, with confirmation below it
📌 Based on the descending channel structure, this might have been the final leg of the downtrend, and a reversal to the upside could be underway. However, for confirmation, we prefer to wait for stronger price action signals before fully committing.
🛑 Always use risk management. Market remains bearish until proven otherwise.

ADAUSD long termADAUSD long term
I think the 7 wave is finished.
I Hope that Btc break the price 112k .

ADA/USD Thief Trading Plan – Bullish Snatch & Run!🚨 ADA/USD HEIST ALERT! 🚨 – Bullish Loot Grab Before the Escape! (Thief Trading Strategy)
🌟 Greetings, Market Pirates & Profit Raiders! 🌟
🔥 THIEF TRADING STRIKES AGAIN! 🔥
💎 The Setup:
Based on our stealthy technical & fundamental heist tactics, ADA/USD is primed for a bullish loot grab! The plan? Long entry with an escape near key resistance. High-risk? Yes. Overbought? Maybe. But the heist must go on!
🎯 Key Levels:
📈 Entry (Vault Cracked!) → Swipe bullish positions on pullbacks (15m-30m precision).
🛑 Stop Loss (Escape Route) → Recent swing low (4H basis) at 0.5290 (adjust per risk!).
🏴☠️ Target (Profit Snatch!) → 0.6500 (or bail early if bears ambush!).
⚡ Scalpers’ Quick Heist:
Only scalp LONG!
Big wallets? Charge in! Small stacks? Ride the swing!
🔐 Lock profits with Trailing SL!
📢 Breaking News (Heist Intel!):
Fundamentals, COT, On-Chain, Sentiment— All hint at bullish momentum!.
🚨 ALERT! News volatility ahead—Avoid new trades during releases! Secure running positions with Trailing SL!
💥 BOOST THIS HEIST! 💥
👉 Hit LIKE & FOLLOW to fuel our next market robbery! 🚀💰
🎯 Profit taken? Treat yourself—you earned it!
🔜 Next heist incoming… Stay tuned, pirates! 🏴☠️💎

ADA | BTC | ET | Why ALTSEASON is COMING SOONAfter a -34% retracement, ADA is ready to go higher alongside with the rest of the alt market.
We see a very interesting phenomena here, were ADA also represents a large part of the larger alts: BTC pulls back, ETH is starting to increase or trades sideways (before the increase) whilst the alts dip.
This is actually BULLISH for alts, showing the very clear rotation between BTC, ETH and top 15 alts.
If we look at the macro of ANY of the alts I've been working through recently, a similar pattern appears - a clear bottom, followed by a sideways trade. This is usually the point just before the big ALTS season.
We actually see this pattern at the end of the 2018 rally, as well as after the 202- Covid dip:
The bottom line -
ADA and other alts are gearing up for their ALTSEASON. With patience, we will soon see some great gains across the markets.

ADA , 1DAs BTC is Falling And BTC is given Breakout of Pattern in 4Hr , then Remaining coins will also fall drastically .
in 1D pattern of ADA USDT , it is Breaking Down as BTC is also given Break Down of Pattern
Follow for More Ideas like This

ADA's situation+ Target PredictionThe price on the daily timeframe is within a triangle, which can create some uncertainty about which direction it will move. Here, we should wait to see which side of the triangle the price breaks out from. Remember, the trend is our friend.
Best regards CobraVanguard.💚

SHORT Idea on CARDANOThe 0.6020 level has been recently broken and retested. This is a clear confirmation that price has accepted this level as a new resistance and should continue pushing lower .
My target is 0.5688
SL : 0.615

ADAUSDT IDEAlower lows and a flat. Seems to be a trade opportunity which ever side it goes off breaking its current structure.

Cardano and Diametric Pattern
We are currently in wave-g of the Diamond Diametric and it could continue to 0.43.
After the completion of the Diametric, if the Double Combination pattern does not form, we expect an uptrend to form. (The post-pattern movement will show us whether the Diametric has completed or not).
Good luck
NEoWave Chart

HolderStat┆ADAUSD retesting of the $0.6 levelBINANCE:ADAUSDT is orbiting the major $0.6000 shelf inside a fading down-channel. A lift through 0.63-0.64 would flip short-term momentum and open a swift path toward the mid-$0.70s, while a daily close below $0.58 cancels the run-up thesis 📈

#ADA/USDT#ADA
The price is moving within a descending channel on the 1-hour frame and is expected to break and continue upward.
We have a trend to stabilize above the 100 moving average once again.
We have a downtrend on the RSI indicator that supports the upward move with a breakout.
We have a support area at the lower limit of the channel at 0.6300, acting as strong support from which the price can rebound.
Entry price: 0.6360
First target: 0.6460
Second target: 0.6580
Third target: 0.6700
