CardanoAda usdt Daily analysis
Time frame 4hours
Risk rewards ratio >4.3
Target =1.15$
Cardano is the Valuable asset in crypto market
ADAUSDT trade ideas
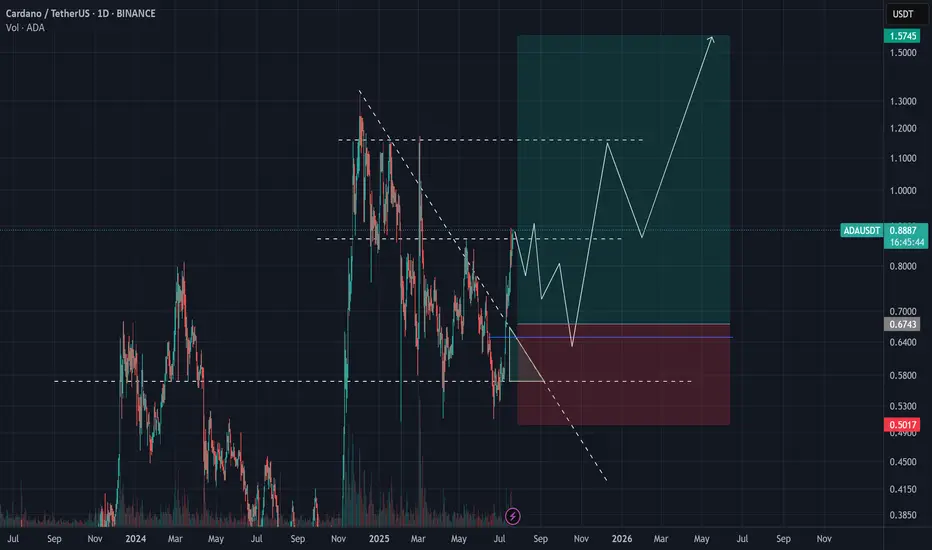
ADAUSDTWith the price stabilizing above the volume range and the descending channel, and if the market sentiment remains positive, we can expect growth to 1.14 in the first step and then 2.
Trading plan for ADALast week, BINANCE:ADAUSDT showed strong upside momentum, breaking the daily timeframe downtrend line and currently holding above $0.7. We're now observing a hidden bullish RSI divergence, suggesting potential continuation toward our third monthly target at $0.82. However, a breakdown below the weekly pivot point could trigger a drop back to the trendline. Full analysis in the video
Trade safe and stay adaptive

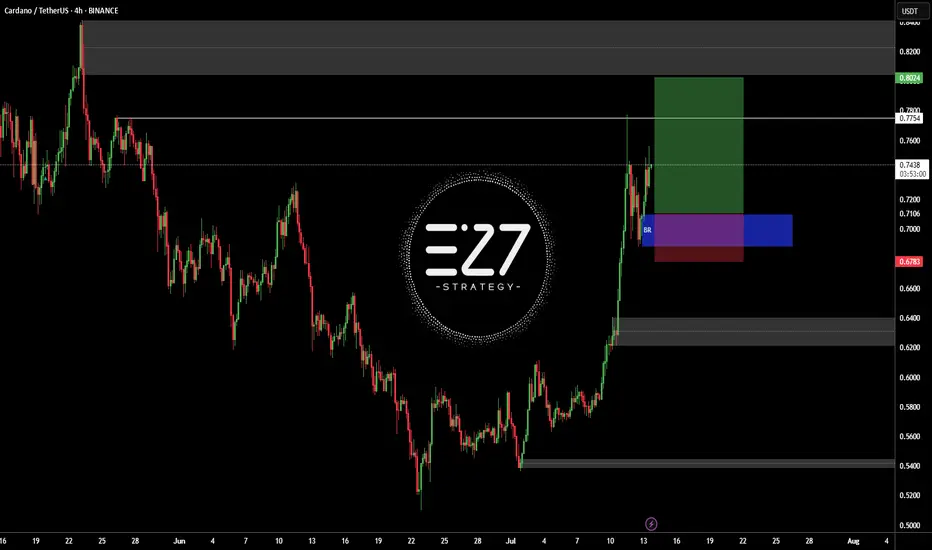
ADAUSDTBINANCE:ADAUSDT in up-trend and my open position buy in latest sowing low.
Best entry: 0.6952 - 0.7259
Target: 0.7754 - 0.8024
Stop loss: 0.678
Please control RISK management
Cardano (ADA) Analysis – July 20, 2025The breakout above the $0.80 level was a major technical milestone for Cardano.
✅ The price not only breached the resistance, but also confirmed it with a strong daily close — clearly signaling that sellers have lost control of the market.
Now, we’re likely to see buyers step in and take over the trend.
🕒 For a more optimal and lower-risk entry, I suggest watching the $0.64 area.
There’s a strong possibility that liquidity around this zone could push the price aggressively toward $2.20, backed by solid bullish momentum.
🎯 This setup offers a promising upside — stay alert for confirmation signals.
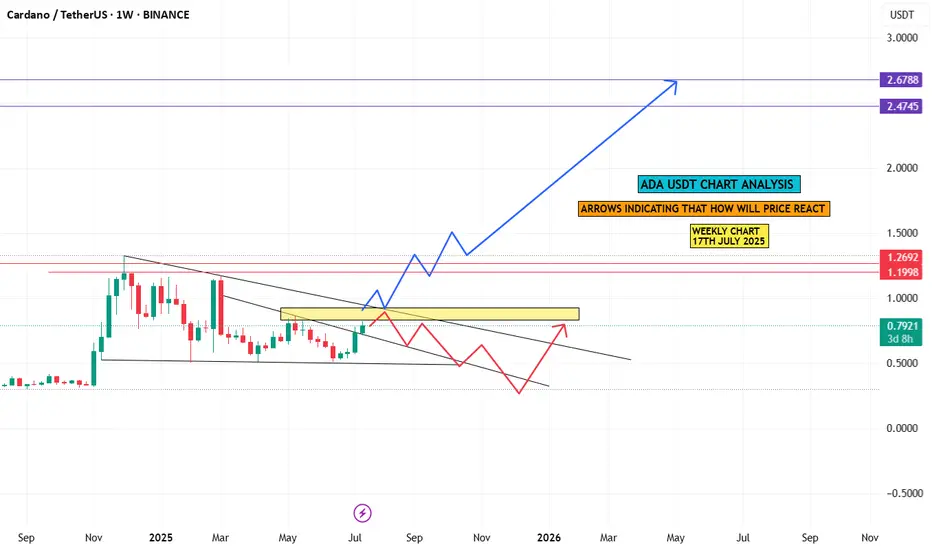
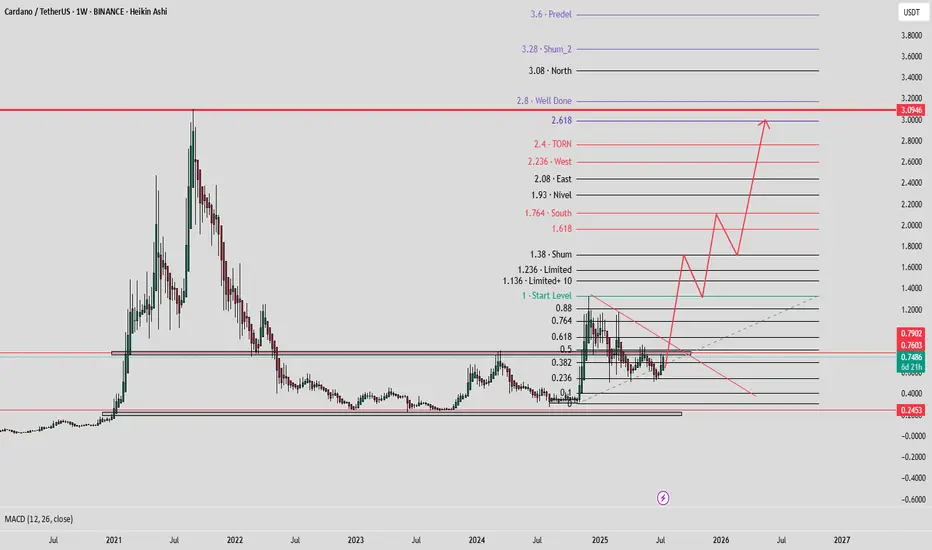
ada chart analysiscardano weekly chart analysis n arrows indicating that how will price react in upcoming
days or months,
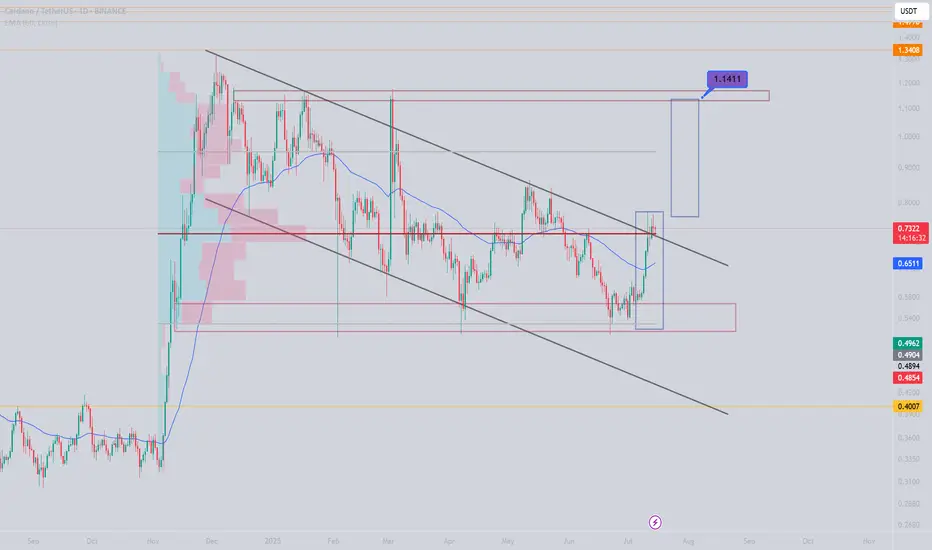
ADA/USDT Trading Ideahi traders
This technical analysis for Cardano (ADA/USDT) outlines a potential breakout or rejection scenario as the price tests a long-term descending trendline.
Key Technical Levels to watch:
Resistance:
$0.7467 (current test of descending trendline)
$1.0227 (primary breakout target)
$1.1635
$1.3213
Support:
~$0.60 (horizontal support zone)
Trendline: The chart features a long-term descending trendline from the February/March 2025 highs. ADA is currently approaching this resistance after a sustained rally from sub-$0.60 levels.
📈 Bullish Scenario:
If ADA breaks above the descending trendline with strong volume:
Expect a continuation move toward $1.0227, the nearest key resistance.
A successful breakout and hold above $1.0227 could open the path toward $1.1635 and eventually $1.3213.
This would signal a potential trend reversal and shift in momentum.
📉 Bearish Scenario:
If ADA gets rejected at the trendline:
Price may fall back toward the $0.60 support zone, where previous consolidation occurred.
This scenario suggests the trendline remains a strong barrier and that ADA may continue ranging or resume a downtrend.
*How to trade it:
Confirm breakout with volume and daily candle close.
Watch for fakeouts or failed breakouts due to market-wide sentiment shifts.

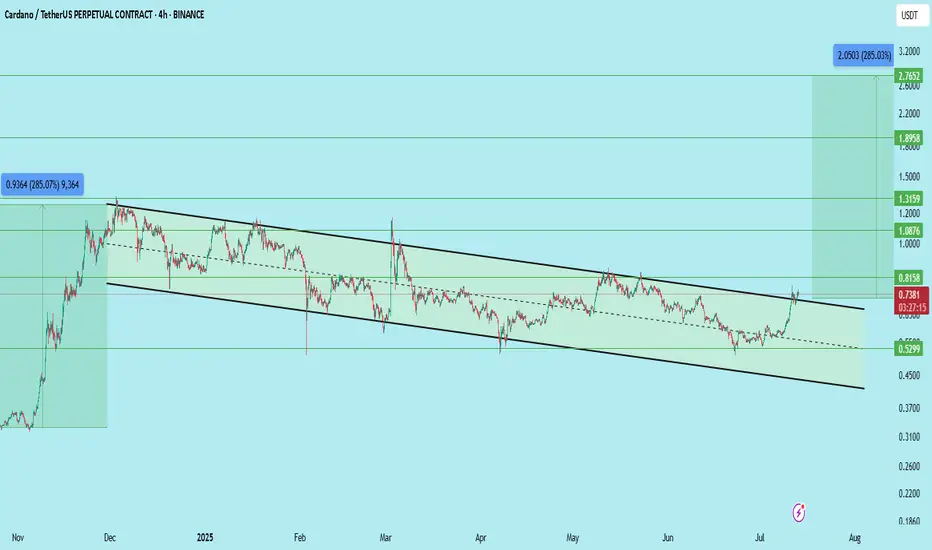
$ADA/USDT — Potential Long-Term BreakoutCardano is showing a major breakout from a long-standing descending channel on the daily timeframe.
Structure:
Downtrend channel respected for ~7 months
Breakout confirmed with a strong bullish daily candle
Price hovering around $0.7192, above previous resistance
Support Levels:
$0.60
$0.5299
Resistance / Long-Term Targets:
$0.8158
$1.0876
$1.3159
$1.8958
Ultimate target (Fib extension): $2.76+
Outlook:
The 285% potential move mirrors ADA’s past rally from similar conditions. If market sentiment continues improving and BTC holds above key levels, ADA might repeat history.
A pullback to $0.60–$0.66 could offer re-entry opportunities.
Bias: Bullish (long-term)
Caution: Not a trade setup—strictly an outlook. Watch BTC/ETH correlation.
DYOR | Not financial advice

accordion to the moonhows and whys of the trade of way out of your IQ level,I'm an Iranian and i'm not going to make you muricans rich while you bomb my country. if it does break above it first high that it will form it becomes really high probability and that's why i published this.

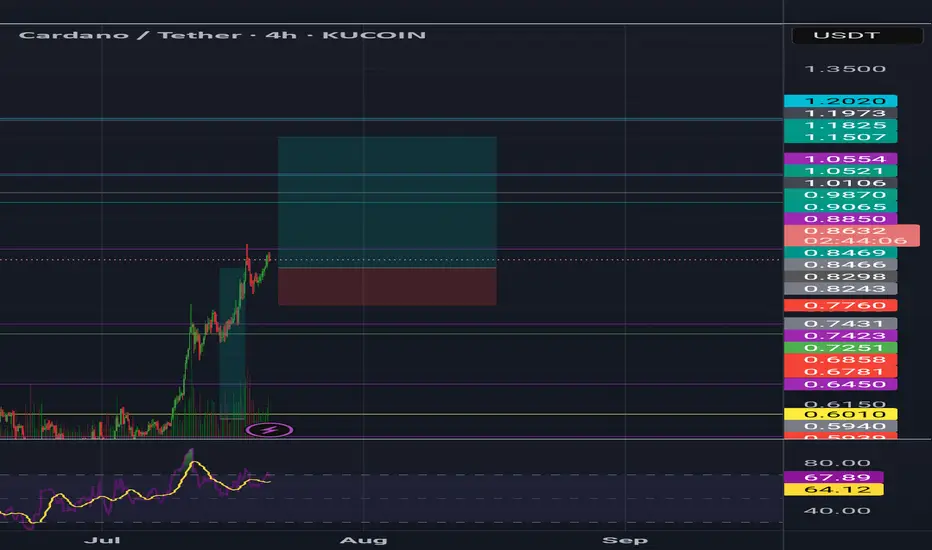
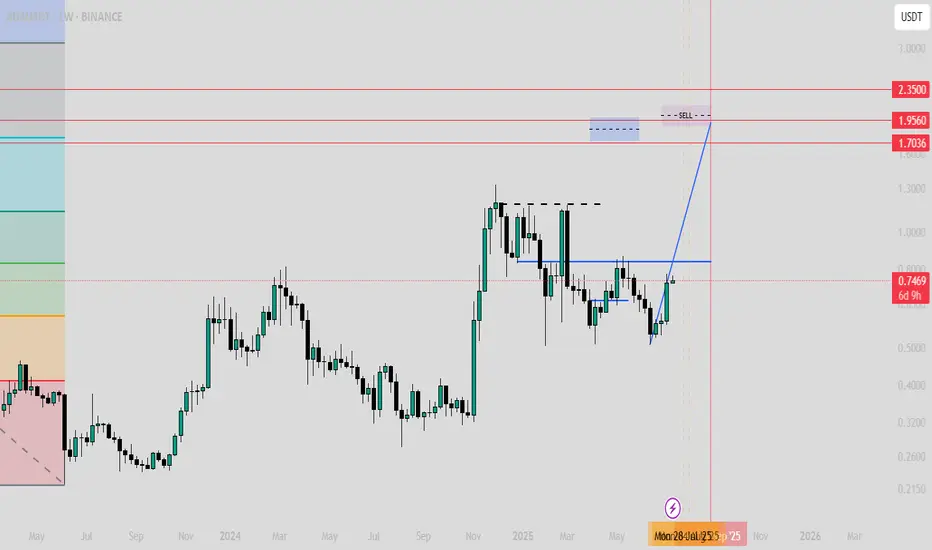
Major Move Ahead for ADA – Breakout or Breakdown?
🔍 ADA/USDT Analysis – Dual Scenario Setup (BUY & SELL)
Currently, ADA is ranging between major supply and demand zones. Two clear scenarios are in play depending on how price reacts to key levels:
📈 Bullish Scenario (Long):
Entry: On breakout and confirmation above $0.6027
Target: $0.869 (major resistance zone)
Stop Loss: Below $0.523
Trigger: Break of descending trendline and solid structure above $0.6027
📉 Bearish Scenario (Short):
Entry: Around $0.5120 (rejection from supply zone)
Target: $0.315 (strong demand zone)
Stop Loss: Above $0.6027
Trigger: Failed breakout and rejection from $0.5120 level, with confirmation below it
📌 Based on the descending channel structure, this might have been the final leg of the downtrend, and a reversal to the upside could be underway. However, for confirmation, we prefer to wait for stronger price action signals before fully committing.
🛑 Always use risk management. Market remains bearish until proven otherwise.

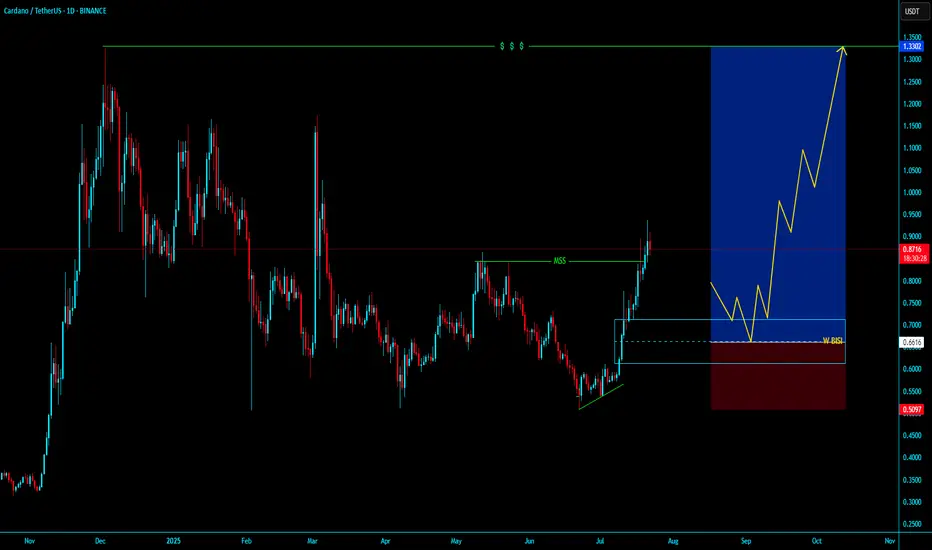
ADAUSDT BUY LONG ADAUSDT BUY LONG Weekly BISI
BullRun will starts it will going to moon for 4-5 month in daily tf .
Valid Mss with ValidOBI our buying zone .54 $ - .72 $ target atleast 7 - 10 $
holding for 3-5 month from buying , deeply buying from this weekly bisi , IF Market will more
correction then more opportunity to buy in deep , patiently wait for Enjoyable Returns
Just Hold & Enjoyyyyyyyyyyyyyyyyyyyy
~ KGB Priyabrta Behera ~
ICT Trader & Advance Mapping SMC Trader
ADA | Trade-updateWe’re in full profit on our CRYPTOCAP:ADA trade.
I took the final profits at the target zone (yellow); just a small portion is still running.
Gave yall that one for free — 68 R/R, lol.
Your win rate doesn’t need to be high — 30–40% with solid R/R is enough to be profitable.
Have a blessed day!

ADA all the way Cardano's Ascent: A Technical Outlook for Q3-Q4 2025
Breaking Through Resistance: Cardano's Path to $1.00 and Beyond
Following a period of extended consolidation, Cardano (ADA) has demonstrated a significant shift in character, breaking out decisively from a key resistance zone. Currently trading near $0.82 as of July 18, 2025, ADA has entered a new phase of bullish momentum. This analysis will dissect the technical landscape to project its potential trajectory through the end of the year, identifying critical price levels and probable targets.
Current Market Context
After consolidating in a range between $0.70 and $0.77 for several weeks, ADA has executed a powerful breakout, surging over 15% in the last few days to establish a multi-month high at $0.825. This move signals a clear victory for buyers and a potential end to the preceding sideways market structure. The immediate challenge for bulls is to defend this breakout level and convert prior resistance into firm support, setting the stage for the next major leg higher.
RSI Analysis: Emerging Strength with Room to Run
The recent price surge has propelled the daily Relative Strength Index (RSI) into overbought territory, currently reading above 70. While this often signals a short-term exhaustion and suggests a minor pullback or consolidation is likely, the underlying momentum on higher timeframes remains constructive.
The weekly RSI is trending sharply upwards from the neutral 50-level but remains well below the extreme overbought readings (80+) that have historically marked major cycle tops for ADA. This divergence between short-term overbought conditions and long-term momentum capacity is a classic sign of a healthy, strengthening trend. It indicates that while a brief pause is probable, the primary path of least resistance remains upward for the coming months.
Price Action & Volume Analysis: The Anatomy of a Breakout
The price action leading up to this point exhibits classic signs of accumulation followed by a markup phase:
Accumulation Phase: The trading range between $0.70 and $0.77 showed contracting volatility and was likely a period of "cause-building," where informed market participants accumulated positions.
Sign of Strength (SOS): The recent impulsive move from $0.77 to over $0.82 represents a clear SOS. This breakout was likely accompanied by a significant increase in volume, confirming the market's conviction and overwhelming sellers who were active at the resistance level.
A successful retest of the breakout zone at $0.75 - $0.77 on diminishing volume would be the strongest possible confirmation of a new, sustainable uptrend.
Supply and Demand Zone Analysis: Charting the Path Forward
The recent breakout has fundamentally altered the market structure, turning a key supply zone into a new floor of demand.
Major Demand Zone (New Support): A critical demand zone has now been established between $0.75 - $0.77. This area, formerly resistance, is now the most important level for bulls to defend to maintain the bullish structure.
Secondary Support Cluster: Should the primary zone fail, the next significant support lies at $0.68 - $0.70, the floor of the previous accumulation range.
Overhead Supply Zones: Unlike an asset at all-time highs, ADA faces historical resistance. The next major supply zones are located near $0.95 and, more significantly, the psychological and technical barrier at $1.10 - $1.15.
Fibonacci Extension Framework: Projecting Bullish Targets
Using the recent swing low of the accumulation phase (approx. $0.70) and the recent swing high ($0.825), we can project logical price targets for the current impulse wave:
The 127.2% extension projects a target of approximately $0.88.
The 161.8% extension, a common target for strong trends, points toward $0.92.
A more extended move to the 200% extension suggests a potential test of $0.97, aligning closely with the psychological $1.00 level.
These Fibonacci-derived targets provide a clear roadmap for the potential upside if the current bullish momentum is sustained.
Price Projection Timeline
Late July - August 2025:
Expect a period of consolidation or a healthy pullback. The overbought daily RSI suggests the market needs to pause. A retest of the $0.77 support level would be a prime opportunity for trend-continuation entries. A successful defence of this zone is critical.
September - October 2025:
Following the consolidation, the trend is expected to resume, targeting the Fibonacci extension levels of $0.88 - $0.92. This move would represent the confirmation of the new uptrend and would likely attract a second wave of buyers.
November - December 2025:
Should the Q4 market environment remain favourable, a push toward the major psychological and technical resistance at $1.00 - $1.15 is highly probable. This would represent a significant milestone and could trigger a more substantial corrective phase as long-term holders take profits.
Support Zones:
Primary: $0.75 - $0.77 (The breakout point; must hold)
Secondary: $0.68 - $0.70 (Floor of the previous range)
Resistance & Target Zones:
Immediate: $0.825 (Recent high)
Target 1: $0.88 - $0.92 (Fibonacci cluster)
Target 2: $0.97 - $1.00 (Fibonacci & psychological level)
Major Resistance: $1.10 - $1.15 (Historical supply zone)
Conclusion: The Road to One Dollar
The technical evidence strongly suggests that Cardano has initiated a new bullish impulse wave. The breakout from its multi-week consolidation range is a significant technical event that has shifted the market bias firmly in favour of the bulls. While a short-term pullback to retest the breakout level around $0.77 is a high probability, this would likely serve as a healthy reset before the next major advance.
Based on the confluence of price action, momentum analysis, and Fibonacci projections, a move toward the $0.95 - $1.15 range is a realistic objective for Cardano by the end of 2025.
$ADA or Cardano analysis (Target is between 1.8 to 2.1)CRYPTOCAP:ADA or Cardano analysis (Target is between 1.8 to 2.1)
this zone is based on few factors such as historical price behavior and fibbo targets
Cardano Ultra Bullish Confirmed, $1.83 Next (Easy) TargetThis is it. This is the signal you've been waiting for and the strongest possible signal across the Cryptocurrency market. Cardano is now moving above MA200 on the weekly timeframe, on a full green candle, as Bitcoin produces a very strong new all-time high. Simply put, this is the best ever.
Cardano has been testing the same low since early February, for five months. Five months and this support held nicely and now the action is turning green. The correction is over; consolidation is over, now comes the resumption of the bullish wave.
The bullish wave will produce a major, major, higher high compared to early December 2024, a target of $1.83 in the coming months and this is not all. This is not the end of the bull market nor the bullish wave, this is just the start, mid-portion, we are set to experience growth long-term.
You can go all-in now. The altcoins bull market is already confirmed. Bullish momentum will start to grow. Feel free to buy and hold.
Thanks a lot for your continued support.
Namaste.

TradeCityPro | ADA Eyes Breakout from Bearish Channel Top👋 Welcome to TradeCity Pro!
In this analysis, I want to review the ADA coin for you. The Cardano project is one of the oldest and most popular projects in crypto.
🔍 The coin of this project has a market cap of 22.21 billion dollars and is ranked 10 on CoinMarketCap.
📅 Daily Timeframe
On the daily timeframe, ADA is moving downward within a descending channel and is currently trying to break out of the channel from the top after reaching a support zone.
⭐ One positive sign for buyers is that they didn’t let the price reach the bottom of the channel. Instead, they used the overlap between the midline of the channel and the key 0.5579 zone (marked as a support area) to stop the price from falling.
✨ However, as long as the coin is fluctuating inside this channel, the trend remains bearish. Holding the midline is not a sign of trend reversal yet, but it does indicate weakening of the current trend and may act as one of the bases for a future reversal.
✅ Looking at the RSI oscillator, we can see that each time the price tried to break the channel’s top, RSI reached the 70 area and got rejected, causing the price to drop.
⚡️ Currently, the price is very close to the top of the channel, but RSI has just broken above the 50 line and is moving upward. This is a bullish sign for buyers, as it shows there is still room for upward momentum, which increases the chance of a breakout.
🎲 The nearest trigger for confirming the breakout from the channel is the 0.7212 zone, which is a bit far, and the price will likely form a higher low and high before reaching it, confirming the breakout earlier.
💥 But based on the current data, the breakout trigger remains at 0.7212, and for spot buying, this is the first valid entry level.
👀 Personally, I’m not adding any altcoins to my portfolio right now, as Bitcoin Dominance is still in an uptrend. As long as this trend continues, large capital flows into altcoins are unlikely.
🛒 More reasonable triggers for spot entries would be a breakout above the 0.8414 supply zone. If I were to buy, I’d enter at this level. The final trigger is 1.1325, which is quite far from the current price, and if BTC Dominance continues upward, it could take several months to reach this zone.
🔽 If you already hold this coin in spot, your stop-loss can be set at a break below the 0.5579 level. A breakdown here would also provide a good short setup in futures, as the price could move toward the bottom of the box or the static level at 0.4322.
📝 Final Thoughts
This analysis reflects our opinions and is not financial advice.
Share your thoughts in the comments, and don’t forget to share this analysis with your friends! ❤️

3ADA Almazov Projection#ADAUSD ALMAZOV PROJECTION WEEKLY
Price projection according to Almazov's theory, #ADA should at least touch $1,71 before pulling back or continuing to go long if its dimensionality decreases (2.0).
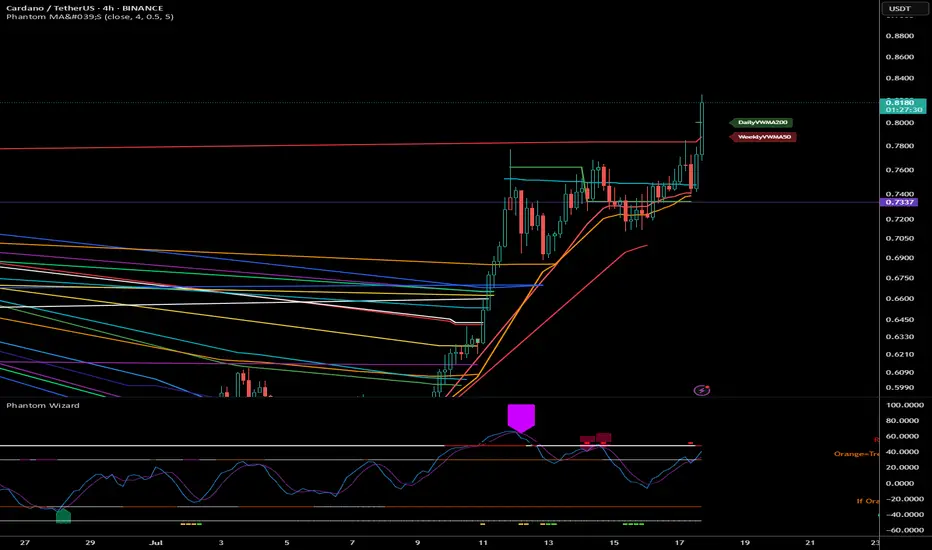
ADA Daily Update · Moving Averages · 262% Target ExposedGood morning my fellow Cryptocurrency trader, I know you are having a wonderful day because the market is doing great. We looked at Cardano together on the weekly timeframe and this is a big picture but what about short-term? Where are prices headed next? The next target, resistance/support and the moving averages of course.
I've been looking at the moving averages lately and this is a theme that I will continue for a few days, or weeks, once we exhaust it we use other indicators. You know we also like the RSI and MACD, candlestick reading, volume, chart structure, chart patterns, market cycle, etc. Marketwide action, subtle signals, market sentiment, on and on.
Cardano is already trading above many major moving averages but this is a recent event. First consider the fact that in late 2024 ADAUSDT grew 320% right after breaking above the same EMAs that I am showing you now.
ADA closed just recently above EMA89, EMA233, EMA55, etc. Only MA200 is missing and this is an important one but will soon break. I am not showing it here because the action is still happening below.
There is a rounded bottom. This alone is a reversal signal already confirmed because the action is happening above the base of the pattern. In April we had a triangular bottom and here we can see an alternation. In February it was a straight line. A straight line, a triangle and then a circle; interesting.
The bullish bias is confirmed and we are seeing straight up, the next target is 0.8194. Cardano has been green four days straight. Go back to November 2024... The possibility exist for continued growth. Day after day after day. At some point there will be a stop, can be a retrace or correction. Know that when this stop happens it is not the end. There will be several stops along the way but we are set for a strong new all-time high. You will need to be patient while holding but just make sure to aim high. Don't get greedy of course. If at some point you start to feel anxious, read on the topic, go out into nature or simple sell a small portion until you feel better. The best choice is to be prepared and this can be done by studying the charts and the market. If you have a good plan and a nice map you will do fine. If you are an advanced trader, I am sorry, let's get back to the chart.
$1.01, $1.30, $1.15. These are all resistance. So there will be some challenge around this price zone. Once it is conquered though the advance should be swift until 1.83. Another stop and then 2.65 which is the main target for 262%. Depending on how this level is handled we will update the chart and the targets. For higher targets look at earlier analyses or those on the weekly timeframe.
Thank you for reading.
Namaste.

ADA/USDT – Bullish Breakout & Retest ConfirmedCardano (ADA) has broken out of a long-standing descending channel and successfully retested the breakout level, showing signs of strong continuation.
Key Observations:
Price broke above the upper trendline of the multi-month falling channel
Retest of breakout zone around 0.74 held firmly
Momentum building after reclaiming key resistance at 0.8158
Entry: Current zone around 0.74–0.75 (post-retest)
Targets:
0.8158
1.0876
1.3159
1.8958
Final target: 2.7652
Stop Loss: Below 0.70 (based on retest invalidation)
This setup has a macro upside potential of over 285% based on the channel breakout projection.
As long as ADA holds above the breakout zone, this structure remains valid and could lead to a sustained rally.
DYOR | Not Financial Advice
Will Cardano’s breakout drive a 15% surge to $0.80?Hello✌
let’s dive into a full analysis of the upcoming price potential for Cardano 📈.
BINANCE:ADAUSDT has broken out of its descending channel with strong volume, indicating a potential bullish reversal. Price is currently near a key support level, setting the stage for further upside. A move toward the $0.80 target, offering at least 15% gain, looks likely. 📊🔥
✨ Need a little love!
We pour love into every post your support keeps us inspired! 💛 Don’t be shy, we’d love to hear from you on comments. Big thanks , Mad Whale 🐋

ADA potential breakoutADA is near a breakout point on the daily timeframe. If we break out the triangle I have 2 targets.
Target 1: $1.135
Target 2: $1.325
Best of luck to all.

ADA / Bulish or Bearish
Hello everyone,
Here’s my analysis of ADA/USDT.
Cardano dropped back below the key level of 0.7446 after a failed breakout. Based on the current market conditions, we can consider three potential scenarios:
1️⃣ Range Scenario:
Price may consolidate between 0.7446 – 0.7041 for up to two weeks.
2️⃣ Bullish Scenario:
A new bullish move depends on a breakout of one of the following levels:
A. Riskier long position: Breakout above 0.7446
B. Safer long position: Breakout above 0.7600
🟡 Note: In scenario B, the stop-loss will naturally be wider.
3️⃣ Bearish Scenario:
A breakdown below 0.6892 could occur — but this does not immediately suggest a short setup.
❗️In that case, we must re-analyze TOTAL, TOTAL2, USDT.D, and BTC.
✅ If the overall market is bearish, a short could be valid.
🟡 Otherwise, it may simply be a deeper correction rather than a trend reversal.
---
🙏 Thanks for reading!
If you found this analysis helpful, hit the 🚀 icon to support the content.
#Cardano #ADAUSDT #CryptoAnalysis #TechnicalAnalysis #Altcoins #TradingStrategy #MarketOutlook #SwingTrade #CryptoTA #BitcoinDominance #TotalMarketCap #USDTdominance #PriceAction

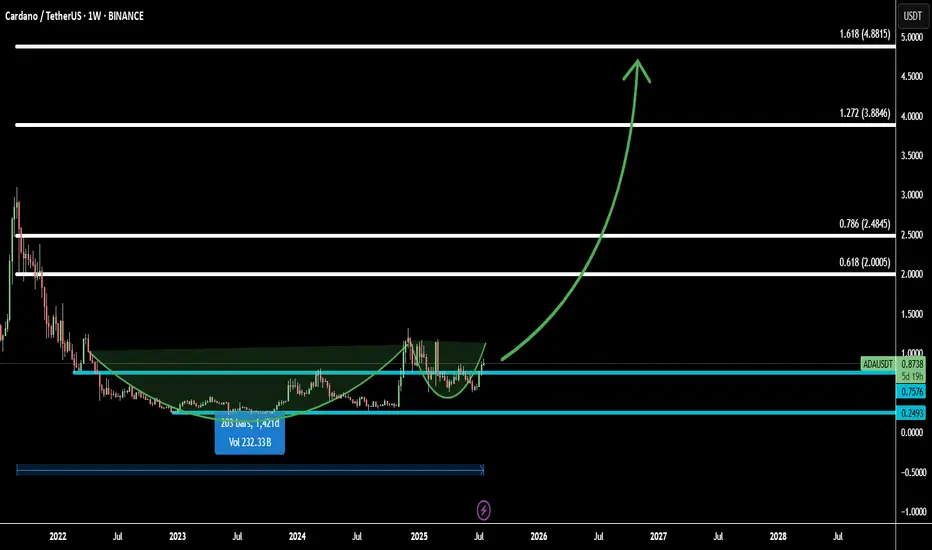
ADA Ready to Fly: Cup & Handle Pattern + Fibonacci TargetsCardano (ADAUSD) is forming a classic cup and handle pattern on the higher timeframe, signaling a bullish continuation setup that often precedes strong upward moves.
Combined with Fibonacci extensions, the breakout potential is high, with multiple target levels mapped out:
Target 1: 0.618 Fib – 2.0005 - confirms breakout strength
Target 2: 0.786 Fib – 2.4845 - momentum continuation zone
Target 3: 1.272 Fib – 3.8846 - full extension based on pattern measurement
Target 4: 1.618 Fib – 4.8815 - aggressive bull target for long-term holders
If ADA breaks the handle with strong volume, it could initiate a powerful rally. This setup is ideal for swing traders looking for a high-probability entry.
Let’s catch the next big move together! 🚀