ADA Analysis: Key Levels and Trend Outlook 2024.12.28Hello, this is Greedy All-Day.
Today’s analysis focuses on ADA (Cardano).
Weekly Chart Analysis
Looking at the weekly chart, ADA is currently within the green box frame.
However, unlike the past, where the price oscillated within a box range with alternating bullish and bearish candles, the current zone has seen three consecutive bearish weeks, signaling persistent selling pressure.
Key Support Zone: Red Box
The red box represents the resistance level from 2022 before the breakout. It is now acting as a support zone under test.
If the support holds: ADA may follow a similar range-bound movement as seen in the green box on the left.
If the support fails: ADA is likely to drop further into the yellow box zone.
Breakdown Scenario:
If the yellow box support also fails, ADA may enter the blue box frame, with the potential to decline to as low as 0.216.
Daily Chart Analysis
The daily chart reveals several bearish patterns:
Head & Shoulders (H&S) pattern is complete.
Descending Triangle pattern is also complete.
Key Observation:
ADA is currently holding the 0.87 support level.
However, if the price breaks below the Ichimoku Cloud on the daily chart, the bearish patterns suggest a significant loss of buying momentum and a potential shift to selling pressure.
Target:
If the bearish scenario unfolds, the expected sell-off could lead to a 51% decline, with the price first testing the yellow box zone.
Additional downside potential will depend on whether support emerges in the yellow box zone.
4-Hour Chart Analysis
The 4-hour chart confirms that ADA has broken its short-term trendline, indicating a definitive shift in momentum.
Buying pressure appears to have dissipated, suggesting that the bullish trend is effectively over for now.
Upside Potential:
For ADA to regain bullish momentum, it would need to climb back above $1.00.
Until that happens, the market should be approached with a sell-oriented perspective.
Conclusion
ADA is currently in a bearish trend, with critical support levels being tested.
If 0.87 support holds, a temporary range-bound movement may occur.
If it breaks, ADA could fall to the yellow box zone or even enter the blue box frame, with a potential low of 0.216.
For now, a sell perspective is more appropriate, with cautious monitoring of the $1.00 level for potential signs of recovery.
Trade wisely, and best of luck! 🚀
ADAUSDT trade ideas

ADA to the OB 0.7382Placing 0.7382 as the TP of the SHORTS. SL of 0.94 RR 1:3 overall stances show that cardano looks half to join the OB

Be careful with ADAUSDT !!!After breaking the descending wedge, the price fell to the support line. As you can see, the price has now formed an ascending wedge, which is promising. The price could rise to $1.07 after breaking this wedge, but considering the Christmas holidays, this might take a bit longer.
Give me some energy !!
✨We spend hours finding potential opportunities and writing useful ideas, we would be happy if you support us.
Best regards CobraVanguard.💚
_ _ _ _ __ _ _ _ _ _ _ _ _ _ _ _ _ _ _ _ _ _ _ _ _ _ _ _ _ _ _ _
✅Thank you, and for more ideas, hit ❤️Like❤️ and 🌟Follow🌟!
⚠️Things can change...
The markets are always changing and even with all these signals, the market changes tend to be strong and fast!!

Long ADA Arguments
- false falling
- good news background
- crossing a resistance and reflecting from it
- low peak of open interest ( shorts come out )

TradeCityPro | Cardano : On the Way to a New ATH👋 Welcome to TradeCityPro!
In this analysis, I will review the ADA coin for you. The Cardano project is one of the major projects in the crypto space and has been among the top 10 coins by market cap for a long time.
📅 Weekly Timeframe: Moving Towards ATH
In recent weeks, ADA has shown a strong upward trend, forming significant lows that serve as support levels for the price.
📈 Currently, the price is struggling with the resistance level at 1.2046, and if this level is broken, the next major resistance will be the ATH.
🧩 The RSI oscillator entered the overbought zone during the price pump, reaching 82.87, and is now in a corrective phase, moving below the overbought level.
📊 The buying volume in recent candles has been substantial, supporting the trend and showing convergence.
🔽 In case of a correction, the first support level is at 0.7683, which the price has already reacted to once. If a deeper correction occurs, the last support for this bullish leg is at 0.4322.
✅ The primary support levels are 0.3166 and 0.2427, which are critical and unlikely to be easily lost.
📝 Final Thoughts
This analysis reflects our opinions and is not financial advice.
Share your thoughts in the comments, and don’t forget to share this analysis with your friends! ❤️

ADA. Spot Entry Alert: Perfect Fibonacci Reversal! 12/24/24BINANCE:ADAUSDT
The market experienced a pullback, with the price returning to the lower boundary of the range. After breaking its support, it moved to a high-volume level, where strong buyers were present. Additionally, a proper Fibonacci correction was achieved, which might signal a potential reversal and an attractive spot entry point.
The $0.9388–$0.9088 range appears appealing for purchases, with targets at $1.2350–$1.3264.
DYOR.

bullishif we look to be bullish for the next month of two i can see first target being $1.40 then $1.75 and third target $2.29. If you haven't bought in yet i would recommend buy on low lev max 3x or best way is spot buy.

ADAUSDT: Another bull run to continue! All crypto pairs are expected to touch back again to their previous yearly high. As we are heading towards the holidays season we can see low volume within the market. We can expect price to continue growing in coming weeks, use accurate risk management.

ADA ghost blockchain. Slowly dying into 2026Not holding any Cardano. I don't see anything good about this blockchain in the next 2 years.
I think ADA topped out for this bull market and publishing this to track how it goes.

ADA can Increase?ADA is now in a Falling wedge which means the price has a great chance to Increase
we have to wait and see if the break out gonna happen or not.
expecting the price to reach 1.23 afterward

Ada the fastest blockchain in the world.Ada recently demonstrated a whopping 1 million TPS. I’ve always been a fan of Cardano for its reliability. With unlimited potential and adoption Ada can see a significant rise against usd in the coming years. I don’t believe in EOY predictions simply because manny obstacles stand in the way of crypto adoption. DYOR!


ADAIn the short term if we can't close above $0.90 we are looking for more bearish action, its the ideal move to add more to your positions but market manipulators are at it right now so very hard to predict.

Cardano (ADA): Possible 10% Drop Coming!!!Cardano coin has a good possibility to break a local resistance on smaller timeframes and move to the major support zone on the daily timeframe, which would result in a nice 12-15% of market price movement!
More in-depth info is in the video—enjoy!
Swallow Team

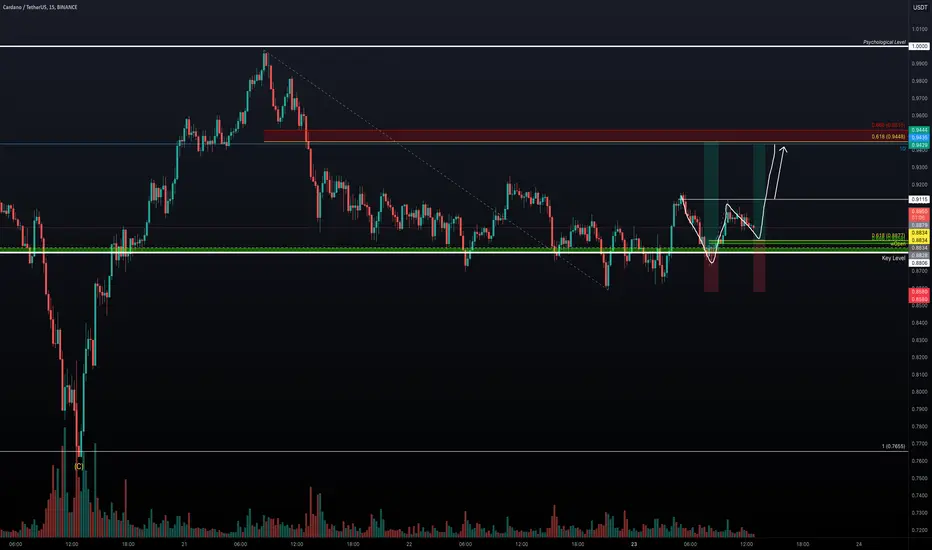
ADA - Gearing Up for a Breakout?After an impressive rebound from the trend-based Fibonacci extension 1:1 at $0.7655, ADA has been consolidating between $0.92 and $0.85 for the past two days. As the new week begins, today's wOpen at $0.8834 is a critical support level, perfectly aligning with the key level at $0.8806. Holding above these levels reinforces a bullish outlook.
Key Insights and Trade Setups:
Support Zones to Watch:
$0.8834 (wOpen) and $0.8806 (Key Level).
Maintaining above these levels keeps the bullish structure intact.
Long Setup Options:
A great long opportunity was from today’s wOpen ($0.8834).
Alternatively, wait for a retracement to the golden pocket at $0.8877 of this current wave.
R:R: 2.5, a solid potential reward for the risk taken.
Target for Long Trades:
Aim for the Fibonacci 0.618 level at $0.9448, which aligns with the daily resistance level.
This zone also represents a high-liquidity area where short sellers may be forced to exit positions.
Pattern Confirmation:
The potential formation of an Adam and Eve pattern strengthens the bullish case. Confirmation comes above $0.9155, suggesting further upside.
ADA/USDT Trading Scenario UpdateThe asset has shown a strong upward trend, rising from $0.3190 to $1.3264, indicating increased market interest. This growth was accompanied by higher trading volumes, which confirms its strength. Currently, ADA is in a correction phase, which has already retraced over 40% from its peak.
The key POC (Point of Control) level of the current local uptrend cycle is at $0.5979. This volume-based level could serve as support and potentially mark the beginning of a reversal. For investors, this represents a good entry point to purchase the asset at a more favorable price before a potential altseason.
It’s important to monitor the price action near this level, as its reaction could determine the further direction of movement.

Cardano instant analysishello friends
By breaking the red support zone, ADA gives us this signal that there is a high possibility of price correction. We have considered two specified areas for buying it, which I hope you like, and the targets are also specified.
Be successful and profitable.

ADA - Time to buy again!As I mentioned in previous analyses, ADA finally broke the wedge and the price turned bearish. However, now if the price can break the 0.618 Fibonacci line, it can rise up to $1.
previous analyses
Give me some energy !!
✨We spend hours finding potential opportunities and writing useful ideas, we would be happy if you support us.
Best regards CobraVanguard.💚
_ _ _ _ __ _ _ _ _ _ _ _ _ _ _ _ _ _ _ _ _ _ _ _ _ _ _ _ _ _ _ _
✅Thank you, and for more ideas, hit ❤️Like❤️ and 🌟Follow🌟!
⚠️Things can change...
The markets are always changing and even with all these signals, the market changes tend to be strong and fast!!


CARDANO's equating momentum BUT SMOL SCALP!DOodle specialist has drawn the porbable scenarios. The point i made if it defends then its gone

ADA PADA - Riding the Wave!ENZOY this! STOPS below the hammer, though GETH READY FOR TEH RIDE! MY DOODLE SAYS ALOT

ADA. Correction Opportunity: Don’t Miss This Entry! 12/20/24BYBIT:ADAUSDT
The market experienced a pullback, and the price returned to the lower boundary of the range before breaking through its support and moving toward a high-volume level, where a strong buyer was present. We also saw a proper Fibonacci correction, which might indicate a potential reversal and a good entry point for a spot position.
I'm entering with 0.5% of my deposit and will add another 0.5% in case of further correction.
DYOR.

ADA USDTCardano has experienced a 40% decline from its recent high and is now retesting key higher timeframe support levels. This zone presents a strategic entry point for positioning ahead of the next upward move.
