ADA/USDT : ADA Rally in Motion – Over 20% Gain and More to Come?By analyzing the Cardano (ADA) chart on the 3-day timeframe, we can see that after revisiting the $0.57 zone, the price once again followed the previous analysis and encountered strong buying pressure—rallying up to $0.61 so far.
The return from the previous entry has now exceeded 8%, and the overall gain from the full move stands above 20%.
The next bullish targets are $0.76, $0.93, $1.05, and $1.33.
(A deeper and more detailed analysis is recommended for long-term investment decisions.)
THE MAIN ANALYSIS :
ADAUSDT trade ideas

DeGRAM | ADAUSD above the demand zone📊 Technical Analysis
● ADA is testing the confluence of the long-term support line and the 0.54-0.63 demand zone; every prior touch of this area sparked a 20-30 % rebound.
● A falling wedge within the broader descending channel is close to completion; a 16 h close above the wedge roof (~0.66) activates a measured move to the first horizontal resistance at 0.73 and the channel cap near 0.86.
💡 Fundamental Analysis
● The upcoming Chang hard-fork, which introduces on-chain governance and boosts staking utility, is scheduled for main-net in Q3 2025, lifting on-chain activity and TVL.
✨ Summary
Long 0.58-0.63; wedge breakout >0.66 targets 0.73 ➜ 0.86. Bull bias void on a 16 h close below 0.54.
-------------------
Share your opinion in the comments and support the idea with a like. Thanks for your support

#ADA Almazov Projection#ADAUSD ALMAZOV PROJECTION WEEKLY
Price projection according to Almazov's theory, #ADA should at least touch $1,60 - before pulling back or continuing to go long if its dimensionality decreases (2.3).

ADA LONG TRADE ADA has broken out of its long-term wedge pattern and looks poised for a move higher. With such a strong risk-to-reward setup, the trade makes sense even without a large position—especially important given the uncertainty around current tariff discussions.

Cardano Forming Potential Reversal Structure Inside TriangleHello guys!
Cardano’s been stuck inside this big descending triangle for months. We had a fake breakout a while back that totally failed.
Now, price is back at support and showing bullish divergence. That’s usually a sign sellers are getting tired.
If buyers step in here, I’m expecting a move back up toward 0.67–0.70 (top of the triangle). But if it loses the 0.53 support, that setup’s off the table.
Bias: Leaning bullish
🎯 Target: 0.67–0.70
Invalidation: Clean break below 0.53
Let’s see how this plays out.

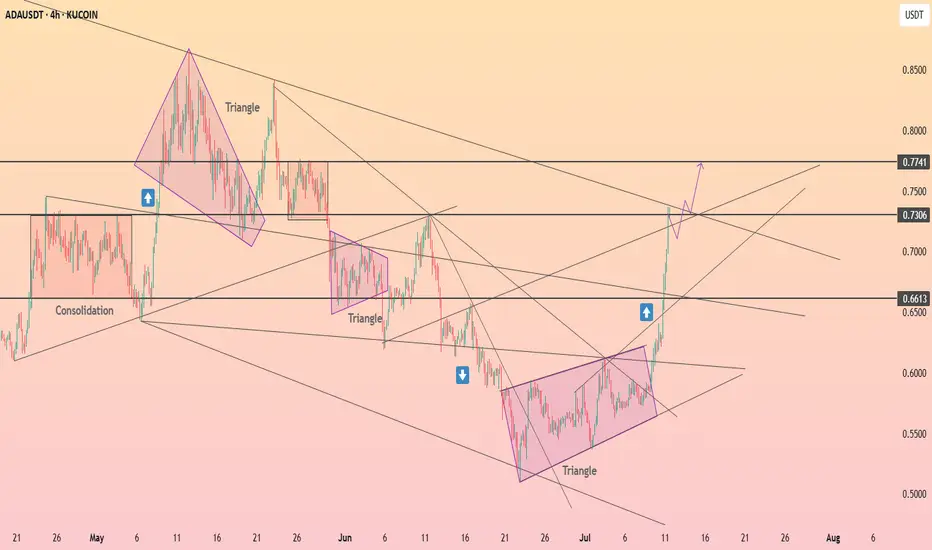
HolderStat┆ADAUSD seeks to $0.774KUCOIN:ADAUSDT recently broke out of a multi-week triangle formation on the 4H chart. The clean break above 0.66 has invalidated the previous downtrend and triggered a new leg higher. With ADA currently riding within an ascending channel, the path toward 0.73–0.75 remains open as momentum continues building.
Can we break above the 0.8063-0.8836 range?
Hello, traders.
If you "Follow", you can always get the latest information quickly.
Have a nice day today.
-------------------------------------
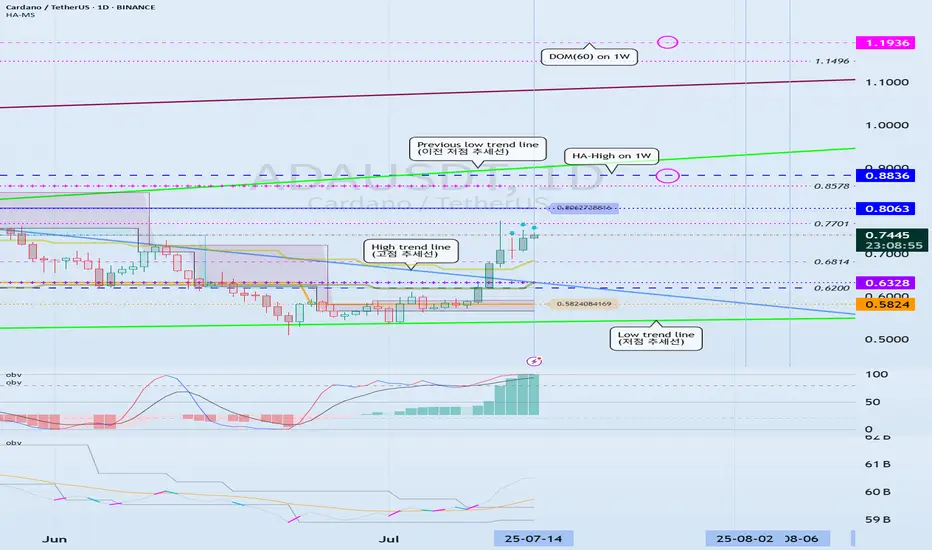
(ADAEUSDT 1D chart)
ADA is forming a long-term rising channel and is showing an upward trend as it breaks above the mid-term high downtrend line.
We need to see if it can rise above 0.8836 and maintain the price to rise above the previous mid-term low trend line.
-
The DOM(60) indicator is showing signs of being newly created.
Accordingly, we need to see where the DOM(60) indicator is formed.
Since the HA-High indicator is formed at 0.8063, in order to continue the upward trend, it must rise at least above 0.8063 to maintain the price.
Accordingly, the key is whether the price can be maintained above 0.6328.
-
It is possible to show a mid- to long-term upward trend only if it breaks through the HA-High ~ DOM(60) section of the 1W chart upward.
Therefore, the 0.8836-1.1936 section is likely to be the resistance section.
-
Based on the current price position, the support section is the 0.5824-0.6328 section.
However, since the positions of the HA-Low indicator and the DOM(-60) indicator are switched, if it shows a downward trend, there is a possibility that a new HA-Low indicator will be created.
If a new HA-Low indicator is created, it is important to determine whether there is support near it.
-
Thank you for reading to the end.
I hope you have a successful trade.
--------------------------------------------------
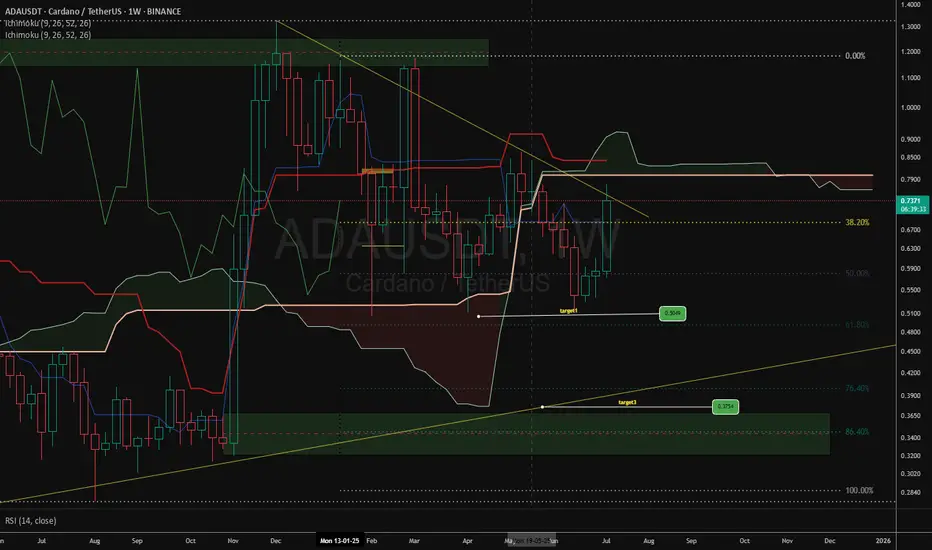
- Here is an explanation of the big picture.
(3-year bull market, 1-year bear market pattern)
I will explain the details again when the bear market starts.
------------------------------------------------------
ADA WCardano is currently back to the flat cloud after breaking the cloud and is continuing its downward trend again until the tarkett is visible in the picture. My good friend, this is my personal opinion. Please make a rational decision.
ADA/USDT Ready to Explode? Watch This Symmetrical Triangle
🧠 Detailed Technical Analysis:
Cardano (ADA) is currently consolidating within a well-defined Symmetrical Triangle pattern on the 3-day chart. This pattern is formed by a series of lower highs and higher lows, indicating compression and indecision in the market — a classic setup for a strong breakout in either direction.
Price has recently bounced off the lower boundary of the triangle and is now heading toward the resistance trendline. A breakout from this structure could trigger a powerful bullish move if confirmed with volume.
🔼 Bullish Scenario (Upside Breakout):
A confirmed breakout above the descending trendline (~$0.65) with strong volume would indicate buyers regaining control.
Key upside targets based on historical resistance zones and the triangle's height:
🟡 $0.8144 – First major horizontal resistance
🟡 $0.9386 – Mid-range resistance from March 2025
🟡 $1.0920 – Former distribution zone
🟡 $1.2118 – Medium-term bullish target
🔵 $1.3264 – Key structural high from previous cycle
🔔 A breakout from a symmetrical triangle often leads to significant price action due to the long period of coiled pressure release.
🔽 Bearish Scenario (Breakdown):
If ADA fails to break above $0.62–$0.65 and gets rejected from the upper boundary of the triangle, the price could:
Revisit the lower trendline support around $0.55
A breakdown below this zone could lead to:
🔻 $0.48
🔻 $0.39
🔻 $0.2756 – A major psychological and historical support level
⚠️ This scenario would invalidate the bullish structure and potentially resume the mid-term downtrend.
📐 Pattern Breakdown – Symmetrical Triangle:
Pattern Duration: ~6 months of consolidation (Feb – July 2025)
Support Zone: $0.55 – $0.60
Resistance Zone: $0.65 – $0.75
Breakout Confirmation: Requires strong bullish candle close with increased volume
Volume Profile: Decreasing, typical of symmetrical triangle before explosive move
💡 Final Thoughts:
Cardano is at a make-or-break point. It has bounced from support and is attempting a breakout from this symmetrical triangle. If successful, this could mark the beginning of a major trend reversal with over +100% upside potential from current levels.
On the flip side, failure to break resistance could lead to a deeper retracement. That’s why confirmation is critical before entering a position!
#ADAUSDT #CardanoAnalysis #CryptoBreakout #SymmetricalTriangle #AltcoinSeason #BullishBreakout #BearishScenario #TechnicalAnalysis #CryptoChart #CryptoTrading #Altcoins

Weekly trading plan for ADALast week, BINANCE:ADAUSDT perfectly followed our bullish scenario and hit all targets. This week, after a false breakout of the weekly pivot point, price reversed and reached TP1. However, we're now seeing rejection at the monthly pivot - expect a potential pullback before consolidation above $0.6. Full analysis in the video below
Trade safe and stay adaptive

ADA/USD Thief Trading Plan – Bullish Snatch & Run!🚨 ADA/USD HEIST ALERT! 🚨 – Bullish Loot Grab Before the Escape! (Thief Trading Strategy)
🌟 Greetings, Market Pirates & Profit Raiders! 🌟
🔥 THIEF TRADING STRIKES AGAIN! 🔥
💎 The Setup:
Based on our stealthy technical & fundamental heist tactics, ADA/USD is primed for a bullish loot grab! The plan? Long entry with an escape near key resistance. High-risk? Yes. Overbought? Maybe. But the heist must go on!
🎯 Key Levels:
📈 Entry (Vault Cracked!) → Swipe bullish positions on pullbacks (15m-30m precision).
🛑 Stop Loss (Escape Route) → Recent swing low (4H basis) at 0.5290 (adjust per risk!).
🏴☠️ Target (Profit Snatch!) → 0.6500 (or bail early if bears ambush!).
⚡ Scalpers’ Quick Heist:
Only scalp LONG!
Big wallets? Charge in! Small stacks? Ride the swing!
🔐 Lock profits with Trailing SL!
📢 Breaking News (Heist Intel!):
Fundamentals, COT, On-Chain, Sentiment— All hint at bullish momentum!.
🚨 ALERT! News volatility ahead—Avoid new trades during releases! Secure running positions with Trailing SL!
💥 BOOST THIS HEIST! 💥
👉 Hit LIKE & FOLLOW to fuel our next market robbery! 🚀💰
🎯 Profit taken? Treat yourself—you earned it!
🔜 Next heist incoming… Stay tuned, pirates! 🏴☠️💎

ADA broke the bull market support band and to the moonBINANCE:ADAUSDT
Typically this should be the first test after the broke out of bull market support band, I would expect it to be 5-10% around (at 4 h level) 20 EMA/SMA or Bollinger band MID. I will buy when 1 h RSI keeps nicely above 50 with a golden cross of stochastic RSI.

ADA/USDT – Mid-Term Technical Analysis
Cardano has just bounced from a key FIBO support zone (0.618–0.786), suggesting that the correction may have bottomed out and a bullish reversal is in play.
📍 Current Price: $0.6235
🎯 Target 1: $0.9989
🎯 Target 2: $1.2164
🎯 Target 3: $1.3795

ADA | Trade-SetupOur trade worked out exactly as planned, and the price reacted perfectly from the 0.667 level, which also overlaps with the bearish target area (green).
✅First take profit was at the overall correction level (green).
Second take profit is when we reach the 100% correction mark at $0.611. At that point, I will secure most of my position and only let a small portion run.

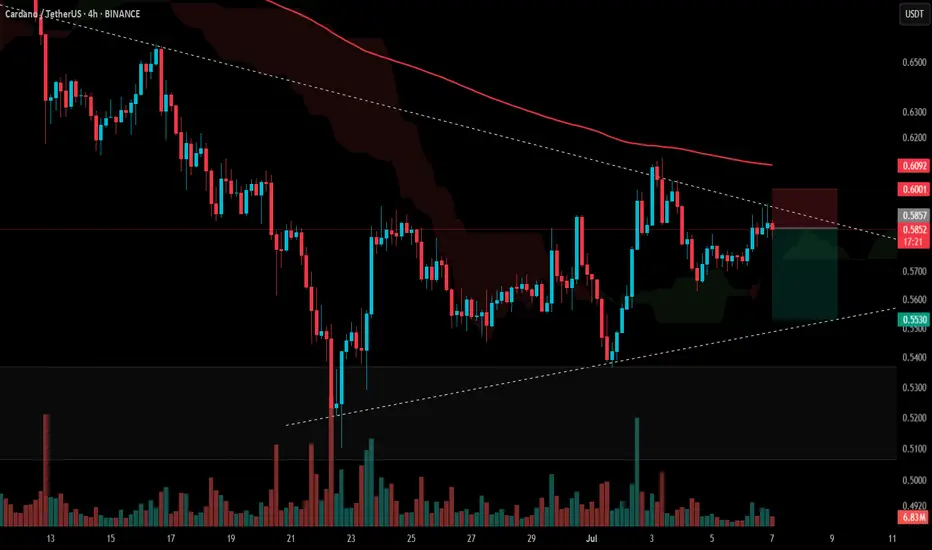
#ADA Update #2 – July 7, 2025🟠 #ADA Update #2 – July 7, 2025
ADA has been consolidating within a descending triangle for a while now. Staying below the 200MA reinforces the bearish outlook, as this level acts as strong resistance. We’re seeing clear selling pressure on upward moves, which is confirmed by low volume on green candles.
Given this structure, it's likely ADA will retest the lower boundary of the triangle. Therefore, I see a short opportunity here.
Trade Plan:
🔘 Entry: 0.5857
🔴 Stop Loss: 0.6001
🟢 Target: 0.5530
At this stage, ADA does not present a favorable long setup. Only the short side seems worth considering.
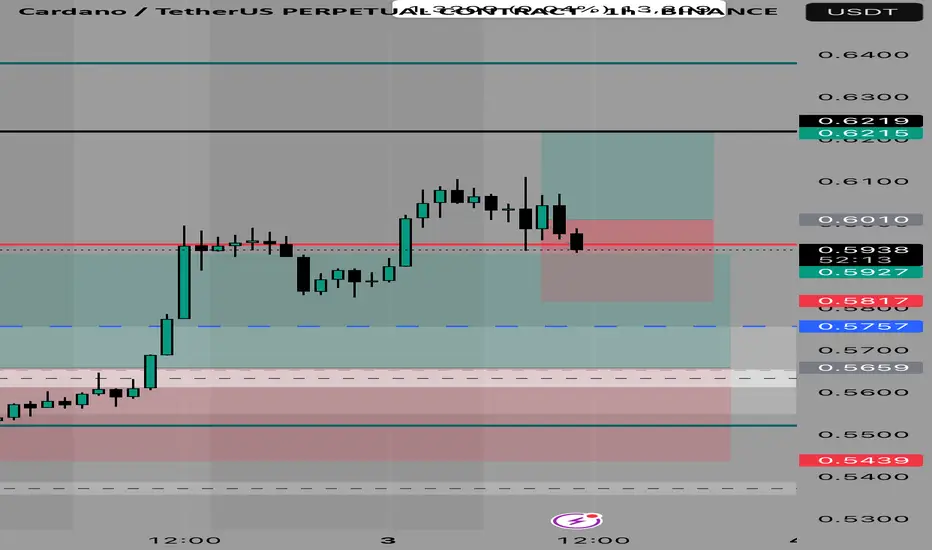
ADA/USDT – Possible ShortADA/USDT – Bearish Reaction from Key Channel Resistance | Short Opportunity
Bias: Short Setup (Counter-Trend)
Cardano (ADA) has reached a significant technical juncture following a strong bullish impulse. Price has tapped into a critical resistance zone marked by:
The upper boundary of a broadening ascending channel
A horizontal liquidity pocket at 0.6195, labeled as “Level 1”
An extended impulsive move without consolidation, suggesting potential overextension
📌 Key Price Levels
Resistance (Short Entry Zone):
Level 1: 0.6195 USDT
Bearish Targets (Take Profits):
TP1: 0.6017 – Local support & minor demand
TP2: 0.5939 – Mid-range value zone
TP3: 0.5842 – Confluence of wedge support & previous demand
The structure resembles a rising broadening wedge, typically a bearish reversal formation, especially after a sharp leg into resistance.
The breakout from the smaller consolidation wedge has now run into major supply, where early short entries may begin to scale in.

HolderStat┆ADAUSD rising topBINANCE:ADAUSDT is breaking out of a falling channel, following a long consolidation period and bullish wedge development. Price action is coiling around 0.58–0.60 and may rally toward 0.65 if the breakout sustains. Historical patterns suggest continued strength from this structure.

ADA / USDT lying on support ,ready to bounce and break trendlineADA/USDT broke above horizontal resistance and is now retesting from the trendline above. If it holds this support and bounces, a strong move toward $1.00, $1.20, and even $1.40 could follow. One to watch closely in the coming days.

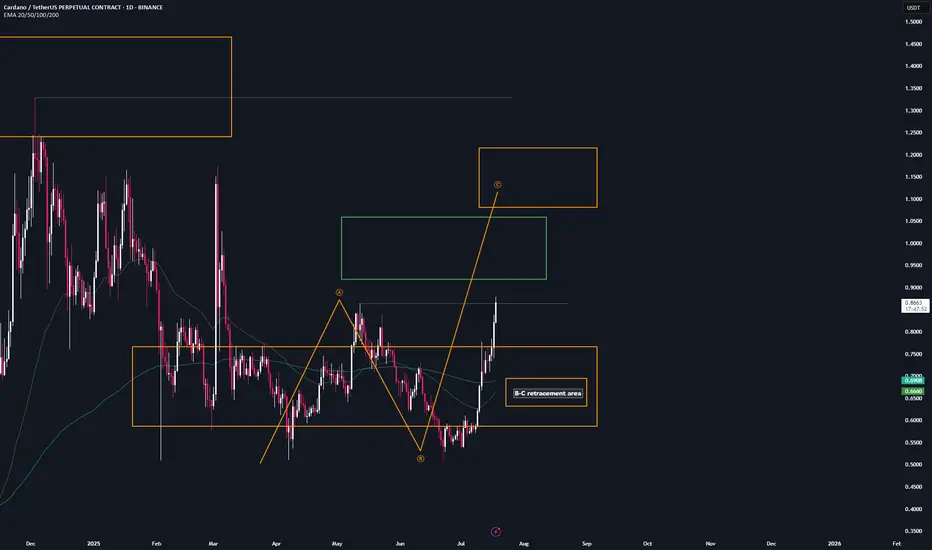
ADA | Trade setup📌 After the breakout from the last high at $0.86, a bullish sequence (orange) has now been activated.
📊 These setups typically occur no more than twice per year on any given altcoin, so I’ll be aggressively buying each level at the B-C retracement area.
Trademanagement:
- I'm placing long orders at each level. ((If the price continues climbing, I’ll adjust the trend reversal level (green) accordingly and update my limit orders.)
- Once the trade reaches a 2 R/R, I’ll move the stop-loss to break-even.
- From a 3 R/R onward, I’ll start locking in profits.
✅ I welcome every correction from here on —
but I won’t enter any new positions at these top levels.
Stay safe & lets make money
ADA idea 03 07 25Grids can it’s a great way to deal with volatility and timming within a range with clear PD Arrays
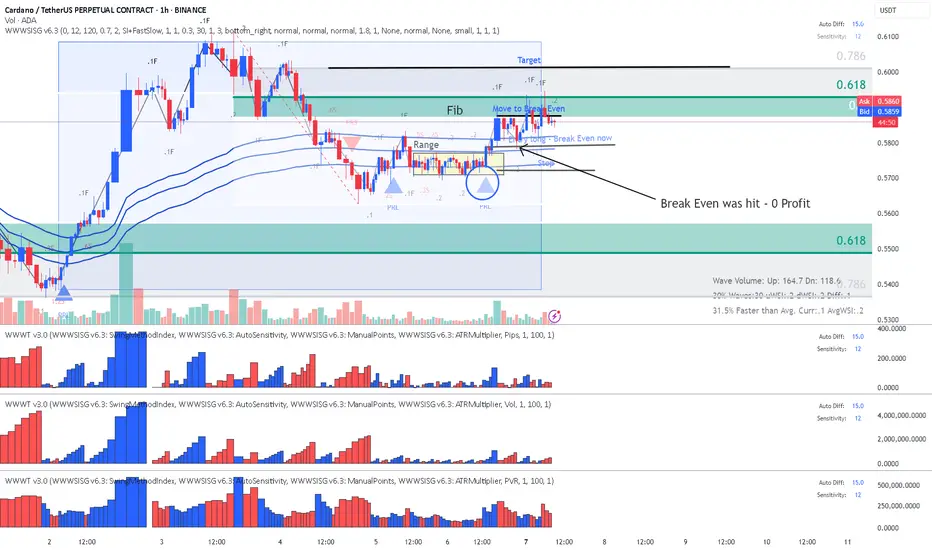
ADA- Cardano - Classic Exit from Range with Plutus signalReading the chart :
AVWAP acted as resistance and we started ranging.
This is a classic entry long for the "SI traders" called Exit from Range with a Plutus signal and in this case it was the PRL signal.
ADA is heading for a major Fib I will not advise any entries now.
Enjoy wave and speed index reading!

ADA long $0.6-$0.61Recently opened a long position on ADA. On the htf which is where I usually filter my trades it looks good. Looks like we at daily Hl area getting ready to push up. As am typing its spiking up.
Time sensitive
Stop: $0.5760
TP1: $0.5990
Tp2: $0.6100

ADA - Cardano - BreakEven was hitFollowing my previous post, these sellers on Fib managed to hit my Break Even - there goes our free trade, but no problem. Mark Douglas used to say "every trade is unique" !!!
Enjoy!