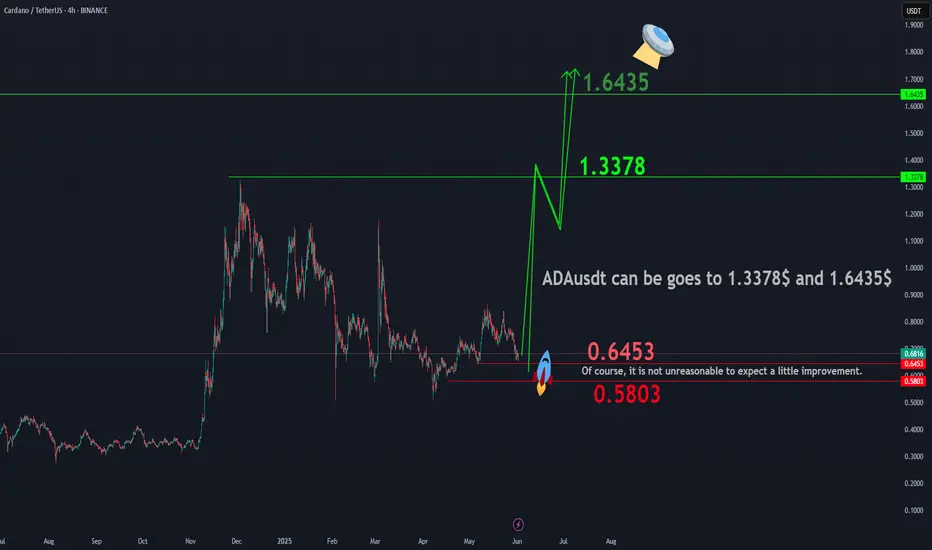
ADAUSDTBINANCE:ADAUSDT shows potential for an upward movement towards the targets of $1.3378 and $1.6435, making the current price zone attractive for long-term investment . While a correction towards $0.6453 or even $0.5803 is possible, these levels present favorable buying opportunities for investors with a long-term perspective. Even if a deeper correction occurs, the market geometry suggests that reaching the aforementioned targets is a likely outcome.
ADAUSDT trade ideas
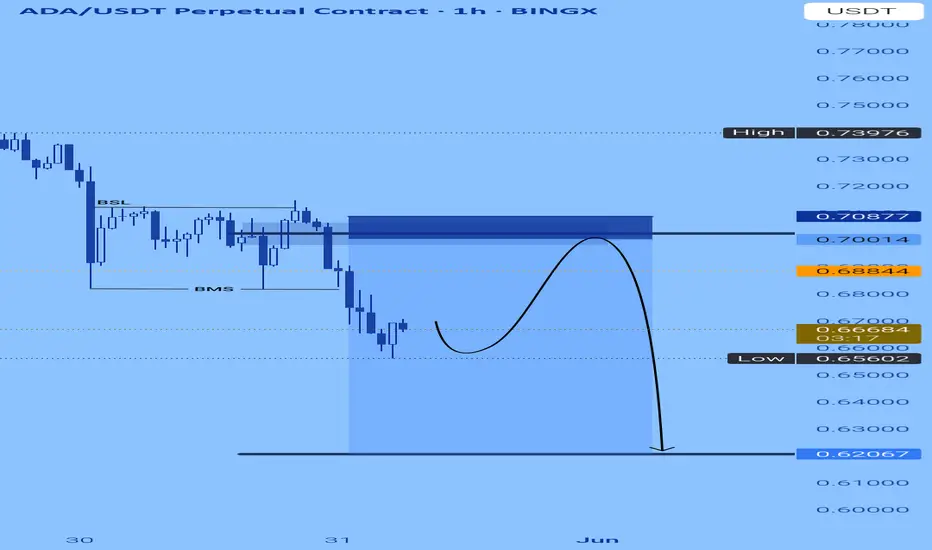
Bearish Divergence Warning: Will ADA Break the Channel?Hello guys!
Cardano has been trading within a rising parallel channel after forming a clear Inverse Head and Shoulders pattern, triggering a bullish breakout. However, recent price action has shown signs of weakness, especially with a noticeable bearish divergence between the price and RSI.
What I see:
The price is approaching the lower boundary of the ascending channel.
A channel breakout to the downside could lead to a deeper correction toward the $0.58–$0.62 support zone (highlighted area), which aligns with previous consolidation and the neckline of the inverse H&S.
If bulls defend the channel and push price higher, a potential rally toward the $0.93 resistance level remains in play.
⚠️ Keep an eye on the channel support and RSI behavior to anticipate the next move.

ADA SHORTReasons for the decline. 1- Strong weekly bearish candle - Liquidity and order block with the aim of buying have been identified - RSI is at the low 50 and moving average. My good friend, I would be happy if you could criticize or confirm my analysis.

Ada might just be forward to short Intermediate BSL taken and price structure broken further to the down; Ada might be better looking to fill the FVg after the displacement to the downside for a bearish continuation.
ADA/USDT: Potential Long Setup from Key Support ZoneTaking a closer look at a potential long opportunity on Cardano (ADA/USDT) with the following parameters:
Entry: Around $0.6938
Stop Loss: $0.6098
Take Profit: $1.1880
Technical Breakdown:
ADA is currently interacting with a critical price zone between $0.6800 and $0.7200. This area has demonstrated historical relevance, acting as both support and resistance in recent months, notably providing a floor for price action through mid-May. My entry anticipates this zone will once again attract buying interest after the recent pullback.
The stop loss at $0.6098 is strategically placed below the significant swing low established in late April. A breach of this level would likely invalidate the current market structure and could signal a more profound bearish continuation.
The take profit target at $1.1880 aims for the prominent highs last seen in early March. This ambitious target reflects an expectation of a strong recovery and implies a potential shift in momentum, possibly fueled by a confluence of technical strength and positive catalysts. The risk/reward ratio here is compelling, sitting near 5.8:1.
Fundamental Watch:
Keep a keen eye on Cardano-specific news. Developments in their ecosystem, progress on roadmap milestones like Voltaire or Hydra enhancements, or significant partnership announcements could provide the necessary bullish impetus for such a move. As always, broader market sentiment will also play a crucial role.

ADAUSDT: Targeting $1.5 Long Term Swing View| Comment Your View|Hello everyone,
The cryptocurrency price is approaching a major bullish zone where it is anticipated to reverse. Price momentum has been slightly bullish in recent times, possibly due to the release of economic data that is against the US Dollar. A weak US dollar has recently influenced the cryptocurrency market volume, resulting in all-time highs. We anticipate similar or increased volume in the future.
We would appreciate your support by liking and commenting on your views about the cryptocurrency pair. Please let us know in the comments if you would like us to analyse any other cryptocurrency or trading pair.
Best regards,
Team Setupsfx_

Daily tf confirmed strong bearish trend!As i said in previous idea for BINANCE:ADAUSDT the daily tf confirmed strong bearish trend and it will continue till reach 0.4$!

HolderStat┆ADAUSD above the $0.72 levelCRYPTOCAP:ADA broke the falling channel, replaced by a higher-low structure; consolidation near 0.75 sits atop trendline support. Maintaining 0.65 keeps bulls in control for a push toward the 0.90 resistance band flagged above.

ADA is getting ready to fly.The cup pattern is forming. If Alt Season takes hold, many of the major altcoins will take over the market liquidity.
Cardano 5X Lev. Full PREMIUM Trade-Numbers (PP: 2110%)I want to share a trade setup that looks really good. It has relatively low risk with a very high potential for reward. The low risk is not based on the amount of leverage but the chart itself.
Notice the low 3-Feb., there is a higher low 7-Apr.
If you can open a position that is safe above the 3-Feb. low, then this would a low risk position and can work for the long-term.
The falling wedge pattern and the two green candles are also great. The previous session and the current active session.
Since we already looked at Cardano in detail, let's focus on the full trade-numbers for this chart setup. Most of the targets should hit within months.
_____
LONG ADAUSDT
Lev: 5X
Current price: $0.6637
Entry levels:
1) $0.6800
2) $0.6300
3) $0.6000
4) $0.5710
Targets:
1) $0.7000
2) $0.8213
3) $1.0130
5) $1.1508
9) $1.8300
12) $2.6500
13) $3.4620
Stop-loss:
Close weekly below $0.5600
Potential profits: 2110%
Capital allocation: 5%
_____
This chart setup can also be approached with 3X since it is already moving.
The amount of leverage you use will depend on your own risk tolerance.
Leveraged trading is high risk. High potential for rewards but also very high risk. This is a game not for kids. This is for adults. Mistakes can result in a major loss. Good decisions can result in big gains.
If you enjoy the content, consider hitting follow and leaving a comment.
Boost also to show your support.
Thank you for reading.
You are appreciated.
Your support is appreciated.
I am here working for you for the long-term.
Namaste.

Cardano Explosive Move Ahead?The daily chart for ADA/USDT shows that Cardano is still trading within a clear descending channel, facing consistent resistance near the upper trendline. Recently, the price was rejected from a key resistance zone Green between $0.8140 and $0.8416. Despite several attempts, ADA has struggled to break above this level, reinforcing the bearish outlook. Strong support lies between $0.5408 and $0.5696 in Yellow, which previously held during a sharp decline in April. Unless ADA breaks above the descending trendline and holds above the Green zone resistance with strong volume, the downside risk remains, with potential for a retest of lower support levels.

Candle PatternsLesson 2: Candle patterns for the home task
Time Frame 4H
1.Bullish Engulfing (4 instances)
2.Bearish Engulfing (4 instances)
3.Bearish Reversal (4 instances)
4.Bullish Reversal (4 instances)
5.Hammer (4 instances)
6.Hanging Man (4 instances)
7.Morning Star (4 instances)
8.Evening Star (4 instances)
9.Bullish Inverted Hammer (4 instances)
10.Bearish Inverted Hammer (4 instances)

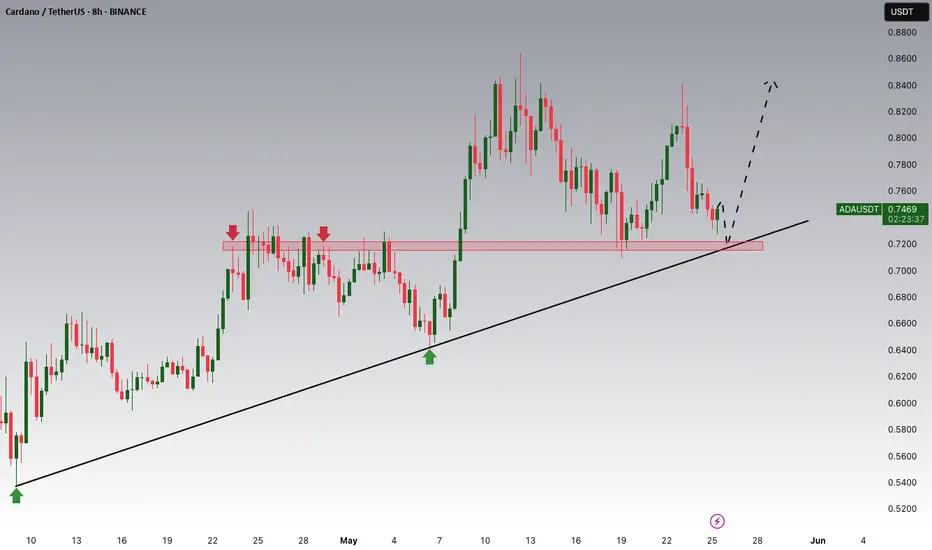
Cardano Potential UpsidesHey Traders, in today's trading session we are monitoring ADA/USDT for a buying opportunity around 0.7200 zone, Cardano is trading in an uptrend and currently is in a correction phase in which it is approaching the trend at 0.72000 support and resistance area.
Trade safe, Joe.
ADA - Time to buy again!The pattern has broken, and now I expect the price to rise to $0.93 . AB=CD.
Give me some energy !!
✨We spend hours finding potential opportunities and writing useful ideas, we would be happy if you support us.
Best regards CobraVanguard.💚
_ _ _ _ __ _ _ _ _ _ _ _ _ _ _ _ _ _ _ _ _ _ _ _ _ _ _ _ _ _ _ _
✅Thank you, and for more ideas, hit ❤️Like❤️ and 🌟Follow🌟!
⚠️Things can change...
The markets are always changing and even with all these signals, the market changes tend to be strong and fast!!

HolderStat┆ADAUSD Cardano’s ascending revivalCRYPTOCAP:ADA — Big falling wedge flipped to upside; price stair-steps through consolidation clusters along an accelerating support beam. Holding 0.78-0.80 keeps 0.90-0.95 target box in play, with 0.72 trendline as fallback. Structure still favors higher-highs path.

ADAUSDT 3D Analysis ADA ~ 3D Analysis
#ADA Buy after successfully breaking through this resistance line with a short-term target of at least 10%++, long-term target $3

TradeCityPro | ADAUSDT Is It Time to Buy Cardano?👋 Welcome to TradeCityPro Channel!
Let’s dive in and analyze one of the market’s favorite coins, Cardano (ADA), which is in a strong position compared to most altcoins and is holding at higher resistance levels.
🌐 Overview Bitcoin
Before starting the analysis, I want to remind you again that we moved the Bitcoin analysis section from the analysis section to a separate analysis at your request, so that we can discuss the status of Bitcoin in more detail every day and analyze its charts and dominances together.
This is the general analysis of Bitcoin dominance, which we promised you in the analysis to analyze separately and analyze it for you in longer time frames.
Bitcoin Chart
📊 Weekly Timeframe
On the weekly time frame, ADA, like SOL, SUI, XRP, and most of the top ten coins in the market, is still in a better situation, with the price fluctuating at higher levels.
After being rejected at 1.1983 and losing support at 0.7959, we experienced a sharp drop to 0.50, driven by panic in the market due to Trump and U.S. tariffs on other countries.
Currently, in the weekly time frame, we’re still at higher levels compared to most of the market, and we can expect a strong move going forward. It’s worth noting that breaking 1.1988 will provide the best trigger for a buy.
📈 Daily Timeframe
Interesting things are happening on the daily time frame, and we’re clearly still at higher levels than other altcoins. If the market itself undergoes a trend change, we can be ready for a long trigger sooner.
After breaking 0.8204 and losing the 0.236 Fibonacci level, we experienced a sharp decline that also saw high volume. I expected that after this volume, we’d transition from volatility to forming a range box, and that’s exactly what’s happening. We’re forming a box between 0.6777 and 0.8204, but if today’s daily candle closes as it is, the downtrend will continue!
Additionally, after this event, we had a break of the support floor that turned out to be a fakeout, leading us to establish a new support level. Currently, our most important support is 0.6090, and we’re moving along a daily trendline. If we bounce from this trendline and break the 0.8419 resistance, it will be the best trigger for a buy. On the other hand, if the support breaks and we lose the 0.7417 low, we can go for a short position.
📝 Final Thoughts
Stay calm, trade wisely, and let's capture the market's best opportunities!
This analysis reflects our opinions and is not financial advice.
Share your thoughts in the comments, and don’t forget to share this analysis with your friends! ❤️

ADA: Bigger move is coming! If you're looking to trade ADA at the moment, here's a quick setup that you might find helpful!
The idea is: Buy when the price breaks above $0.865 and take profits at the levels shown in the chart.
Targets:
1. $0.9
2. $0.98
3. $1.03
-------------------------------------------
About our trades:
Our success rate is notably high, with 10 out of 11 posted trade setups achieving at least their first target upon a breakout price breach (The most on TW!). Our TradingView page serves as a testament to this claim, and we invite you to verify it!

Cardano (ADA) Rectangle + Internal Uptrend (1D)BINANCE:ADAUSDT has spent months ranging between ~$0.51 and ~$1.15, and the structure now clearly qualifies as a rectangle pattern.
After a 3rd touch on support in April, Cardano is showing strength with steady higher lows and a reclaim of a key High Volume Node (HVN).
Key Levels to Watch
• Main Demand: ~$0.51-$0.58
• Rectangle Support: ~$0.51
• Rectangle Resistance: ~$1.15
• Internal Uptrend Support: Rising diagonal from April
• HVN Zone: ~$0.75 — key volume cluster
• Rectangle Midline: ~$0.83 — also a previous S/R
• Main Supply: $1.10–$1.32
Measured Target
If price breaks above $1.15 with volume, the rectangle measured move points to ~$1.80.
Context
ADA has respected this range for nearly half a year. A breakout could mark the start of a macro bullish leg.
Triggers
• Bullish: Clean daily close above $1.15 with volume → $1.80 target activated. For a safer entry, it could be worth waiting a full breakout from the main supply above $1.32.
• Bearish: Breakdown of the ascending trendline and HVN → Potential return to ~$0.51. Failure to hold that level could lead to further downside to the previous ~$0.30 demand zone.

ADA Is Approaching a Trap Zone ? Yello Paradisers, are you watching how ADA is slowly coiling up near a crucial level while pretending nothing’s happening? Don’t be fooled — this is the calm before the storm, and the next move could wipe out the unprepared.
💎#ADAUSDT is currently respecting a well-established ascending channel. We’ve already seen three meaningful reactions at the ascending support, each triggering fresh bullish momentum. At the same time, the price is pressing just above a key demand zone around the $0.73–$0.74 region. This level remains absolutely critical for the bulls to defend if the structure is to remain intact.
💎What adds strength to this setup is #ADA’s current trading position above both the 50 EMA and 200 EMA on the daily timeframe. This reinforces the short-to-mid-term bullish bias. The 50 EMA is starting to slope upward, signaling that momentum could be gradually building, while the 200 EMA sits well below as solid structural support.
💎As long as the price continues to respect the ascending support line and stays above the demand zone, we expect a continuation move toward the $0.8728 moderate resistance. A successful break and close above that could open up the next leg toward $1.0011, where a strong supply zone sits waiting.
💎The real danger lies below $0.6495. A daily close under this level would not just invalidate the current setup it would completely shift market structure and expose ADA to deeper downside, likely towards the $0.60 area or lower.
Discipline, patience, robust strategies, and trading tactics are the only ways you can make it long-term in this market.
MyCryptoParadise
iFeel the success🌴

ADA/USDT (1H Timeframe)Current Price:
$0.7694 (up +1.28%)
Key Observations:
1. Ascending Trendline:
The price is moving along a clear ascending trendline, showing short-term bullish momentum.
The price is making higher highs and higher lows.
2. Immediate Resistance Zone:
Price is approaching a resistance zone around $0.79–$0.80.
This area could act as a strong supply zone.
3. Support Zones:
Minor support near $0.757–$0.760 (recent breakout zone).
Major support lies between $0.740–$0.745.
4. Moving Average:
Price is trading above the blue EMA line, indicating buyers are currently in control.
Possible Trading Scenarios:
Bullish Scenario:
If the price holds above the ascending trendline and breaks the $0.78 resistance:
Long Entry: Above $0.780
Target 1: $0.79
Target 2: $0.82
Stop Loss: Below $0.765
Bearish Pullback Scenario:
If the price gets rejected from $0.78–$0.79 and breaks below the trendline:
Short Entry: Below $0.760
Target 1: $0.750
Target 2: $0.740
Stop Loss: Above $0.770

ADA/USDT -1H
Leverage: 5x–10x
Time Horizon: Within 7 days
---
Entry Zone:
0.7750 – 0.7800 USDT
Targets:
TP1: 0.7480 (+3.5%)
TP2: 0.7290 (+6.0%)
Stop Loss:
0.8440 (-8.9%)
Risk-Reward Ratio:
TP1: ~1:2.6
TP2: ~1:4.5
---
Technical Justification:
Strong resistance zone at 0.7750–0.78 visible across all timeframes.
RSI in 15m and 1h timeframes is in overbought territory → potential pullback.
Stochastic RSI is also peaking in lower timeframes.
In the daily chart, price is near a long-term descending trendline — a key resistance.
Volume weakening near resistance zone.
---
Risk Management Note:
If you're using 10x leverage, size your position so your account risk is capped at ~2–3%.
Invalidation: If a daily candle closes above 0.8130, this setup is no longer valid.

Alert!!! Very very strong bearish trend is coming!If the daily tf confirms its bearish trend the ada may see 0.40$ until next month!! When it confirms i will let you know it in next idea.
