ADA copy pasting movementNote: the numbers are just for labelling. They aren't actual wave counts.
ADA is replicating a 4H movement that led to a big upwards movement. Right now it looks identical. The only difference (in a good way) is that we are using the last resistance as support and that also coincides with the bottom of the bull market support band.
If BTC keeps ranging I totally expect this to play out again.
*Getting bullish thoughts*
ADAUSDT trade ideas

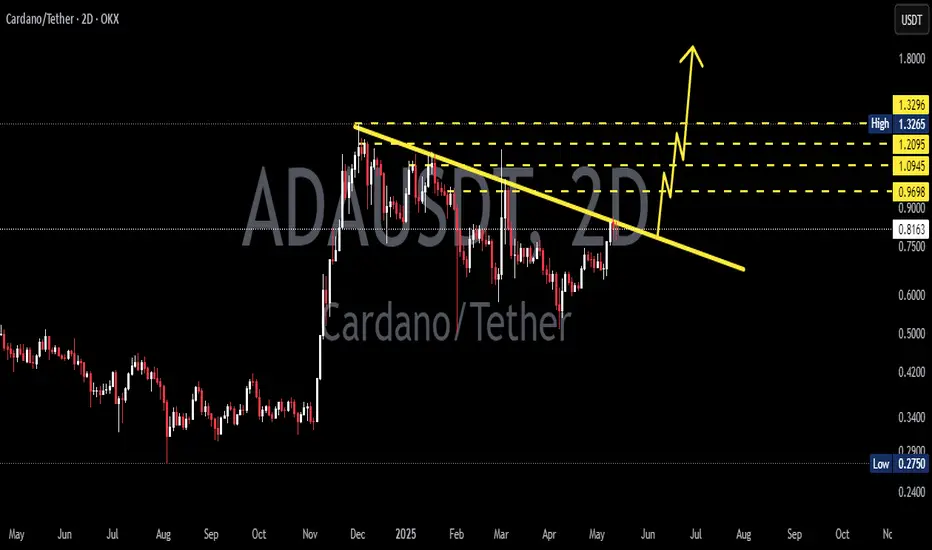
"ADA - Time to buy again!" (Update)So if you pay attention to the ADA chart you can see that the price has formed a Ascending FLAG or wedge which means it is expected to price move as equal as the measured price movement.( AB=CD )
NOTE: wait for break of the FLAG .
Give me some energy !!
✨We spend hours finding potential opportunities and writing useful ideas, we would be happy if you support us.
Best regards CobraVanguard.💚
_ _ _ _ __ _ _ _ _ _ _ _ _ _ _ _ _ _ _ _ _ _ _ _ _ _ _ _ _ _ _ _
✅Thank you, and for more ideas, hit ❤️Like❤️ and 🌟Follow🌟!
⚠️Things can change...
The markets are always changing and even with all these signals, the market changes tend to be strong and fast!!

ADAUSDT IDEAI think chart looks pretty clear now. Red supply area properly laid down. Along with price properly taking buys from demand area in blue with higher lows. So obvious path will be the movement above supply till next supply (red area). Remember the supply is selling area (no retest concept) so strong selling could also originates. so trades are only after breaking out with clear price marching above supply zones.

ADAUSDT"Based on the structure, we’re expecting the start of a mid-term uptrend. The first and second target zones are clear. Let’s go for it!!

CardanoIs ada strong enough to fill the weekly imbalance in the short term. If we can hold the support level then I think we can touch the 1.618 fibonacci level in a few weeks. www.tradingview.com

ADAUSDTADA USDT
SPOT SIGNAL
GREEN LINE FOR BUY
Have 2 entry price
This is a good year for Cardano, look at this signal from a medium-term perspective and wait for a new high for the long term.

HolderStat┆ADAUSD down‑trend break, $1 goalCardano price popped its lengthy descending channel, using a 0.62‑0.78 consolidation base as springboard to reclaim 0.78 USDT. Provided buyers defend that level, the move unlocks an advance into the 0.95‑1.00 resistance ribbon flagged above. A close beneath the rising guideline from April lows would dampen, but not invalidate, the emergent ADA breakout.

Cardano (ADA) Ready to Break Out – Key Levels in Play!Cardano (ADA) Ready to Break Out – Key Levels in Play!
Post with Emojis:
📈🔥 Cardano (ADA) Ready to Break Out – Key Levels in Play! 🚀✨
Hey Traders!
Cardano is back at the spotlight, and this time, the setup looks even stronger! After testing key support zones, ADA is holding above the crucial $0.775 level. The market is coiled tight, and the breakout could come any moment. Are you ready for the move?
📊 Key Levels to Watch:
📍 Immediate Support: $0.775 – Holding strong.
📍 Short-Term Resistance: $0.8368 – Expect a test soon!
🚀 Breakout Target: $1.1930 – First major target on the breakout path.
🎯 Secondary Targets: $1.4757 and $1.8937 – Next zones of resistance if momentum builds.
🏆 Ultimate Bull Target: $3.65 – The long-term upper trendline from the all-time high!
📚 Historical Pattern:
Remember late 2020? ADA compressed for months before exploding upward. The current price action is forming a very similar pattern, and the breakout trajectory is clearly mapped on the chart.
🛠️ Action Plan:
As long as we stay above $0.775, the bias remains bullish.
A breakout above $0.8368 could ignite the next leg towards $1.1930 and beyond.
With stock markets pumping and crypto lagging slightly—this might be the perfect moment to position for ADA’s next big move!
💬 What’s Your Play?
Are you already loading up on ADA, or waiting for the final confirmation breakout? Let’s hear your plans and favorite targets for this run!
One Love,
The FXPROFESSOR 💙

ADAUSDT – Major Breakout Brewing, Watch These Key Levels! 📈🔥 ADAUSDT – Major Breakout Brewing, Watch These Key Levels! 🚀
Cardano is waking up from its long consolidation phase, and the chart is setting up for a potential major impulsive wave. History shows us what happens when ADA compresses at the lower all-time trendline—and we’re right back at that critical point!
📊 Key Technical Levels:
📌 Immediate Support: $0.6799
📌 Resistance Levels to Watch:
$1.1930
$1.4757
$1.8937 – Major Resistance Zone
🎯 Ultimate Target: $3.65 – Upper All-Time Trendline
📚 Historical Context:
We saw a similar accumulation phase back in late 2020 before ADA skyrocketed.
The current price structure mirrors that move, with a clear breakout pattern forming.
🚦 Action Plan:
As long as ADA holds above the $0.6799 support, momentum favors the bulls.
A break above $1.1930 could trigger the next powerful rally toward $2.00 and beyond.
⚠️ Stay mindful of volatility as this breakout zone is tested. Rejections at key resistance could lead to short-term corrections before the next leg higher.
One Love,
The FXPROFESSOR 💙
PS. You HAVE to watch out for this first:


ADAUSDT Bullish PotentialHi there,
ADAUSDT remains predominantly bullish on the H2 chart. The current movement shows a slight correction from the recent high of 0.8288, with some bearish pressure evident on the M3 timeframe.
The target is 0.9004, with a broader bias toward 0.9697, backed by bullish signals in the Weekly and Daily timeframes.
* It is a setup that will require close attention.
Happy trading
K.
Not trading advice

CARDANO CONSOLIDATION - When Breakout?CRYPTOCAP:ADA has been seen to range within the box on the 1hr timeframe chart since Friday 9th May and it’s still within the box. Trade with caution.
Please support this idea with a LIKE👍 if you find it useful🥳
Happy Trading💰🥳🤗

ADAUSDT 2D Analysis ADA ~ 2D Analysis
#ADA Buy after successfully breaking through this resistance line with a short-term target of at least 15%++
Cardano, Next Target (Weak vs Strong Resistance Levels)So the day started with a bearish tune but now is trading green. Based on the overall market conditions, this little event becomes a very strong bullish signal. This happening confirms the continuation of the bullish trend.
Notice thin blue line on the chart, it was drawn weeks ago but ADAUSDT bounced perfectly off this level. This means that the low is in.
With a continuation happening starting now/today, all that matters are the targets.
Where is Cardano likely to face resistance on the way up?
Which level is a strong resistance vs a weak one?
Consolidation has been happening since early February, which means that we have three months the market gaining strength. This means that Cardano can now perform a very strong move.
$0.91 is very easy and should be ignored. This is a weak resistance and Cardano can move straight up. There can be some days as the market never moves straight up, but no corrections or retraces are expected at this point. The same for $1.01. The next resistance is found at $1.15. This one yes, watch out for it.
The $1.15 resistance matches the rejection in early March as well as twice in January. It is also close to the peak in December. I drew a purple dotted line on the chart.
Since the December peak is so close, let's make the next resistance level a zone or range. Between $1.15 and $1.32. Or you can say $1.15 followed by $1.32. This is the first resistance to watch out for but it should break after a few attempts. It will definitely break because we had several months of consolidation and we are super bullish.
After this range, we have $1.83 and $2.64. Can go higher
These targets should all hit within 1-2 months.
I will leave the rest for another article, just so you have a reason to comeback.
Thanks a lot for your continued support.
Namaste.

ADA/USDT Setup – 15-Min Timeframe
Here’s a clean, no-fluff idea built on one clear motto:
Simple but precise.
After a strong push upward and a healthy consolidation near resistance, price looks ready to move — but only if we get a strong breakout with momentum.
✅ Entry upon strong breakout.
Target Zones:
TP1: Around 0.846 – first key reaction level
TP2: 0.858 – structural resistance
TP3: 0.880–0.894 – potential final top zone if momentum holds
Stop:
Placed safely at 0.823, just below structure and invalidation.
STOP
If the breakout comes with conviction, this setup offers a smooth 3-stage path toward profit.
The message here is simple: trust the structure, stay sharp — and let the market come to you.
Nothing fancy. Just precision, timing, and a little confiden
Disclaimer:
All trades carry risk. This setup is shared for educational purposes only.
Any losses or consequences from entering a position are solely the responsibility of the trader.
Always manage your risk and trade responsibly.

cardano next targetsI think Cardano has started the new cycle and can reach the target that I mentioned


ADA | HTF ANALYSIS
BREAKDOWN
Defi EcoSystem - being integrated into lending, yield farming, stablecoins, and more within Cardano DeFi.
Solid Fundementals +
Loyal Customer Base
If Hydra scaling, DeFi adoption, and governance features gain
traction this cycle, ADA could perform well.
One of the tickers thats been a slow mover compartively to
others but is one worthy to hodl
Looking for DCA triggers @ 0.6534ish in the next couple of months while btc can add confluence to the bias by filling lower inefficiencies before moving higher and start an alt season,
Got the Rejection of the Prl (Previous Range Lows) which acted as a local Demand region - too many bids siting @ market price to push the selling pressure lower,
PA will start to accumulate back @ 0.6534ish getting the Orderblock fills added confluence of the prev Bpr (Breaker block) hold that intiated the Move Up,
Leg Up to retest the Prl again while consolidating on the highs to
gather more liquidity before the Squeeze to the Upside.
DCA REGION
- 0.65634
TARGETS
- 2.1, 2.8, 3.33

ADAUSDT IDEALooking for the level breaks to the upside. This indicator has higher accuracy telling in short to medium term trades rather than long term anticipation.

ADA Breakout Brewing – Key Levels in Focus🔥 ADA – Breakout Watch
📅 Daily Timeframe: ADA is testing the upper boundary of a symmetrical triangle—momentum appears to be building!
🕰️ Weekly Chart: The broader trend remains inside an ascending channel, supporting the bigger bullish structure. 📈
👀 Watch for a confirmed breakout before acting—a clean move above could trigger strong upside. Stay alert!

ADA in coming days ...The pattern has broken, and now I expect the price to rise to $1.3 . AB=CD.
Give me some energy !!
✨We spend hours finding potential opportunities and writing useful ideas, we would be happy if you support us.
Best regards CobraVanguard.💚
_ _ _ _ __ _ _ _ _ _ _ _ _ _ _ _ _ _ _ _ _ _ _ _ _ _ _ _ _ _ _ _
✅Thank you, and for more ideas, hit ❤️Like❤️ and 🌟Follow🌟!
⚠️Things can change...
The markets are always changing and even with all these signals, the market changes tend to be strong and fast!!


ADA Holding Key Support — Eyes on $1.13 BreakoutCardano continues to hold the $0.50 zone — a critical level previously acting as resistance, now confirmed as support after multiple successful retests. Structure has shifted bullish with a new higher high and a potential higher low forming in this confluence region. Volume has steadily increased, signaling accumulation.
If ADA maintains this level, the next major resistance lies at $1.13, a previous supply zone that caused a sharp rejection. A breakout above $1.13 opens the path toward $2.00. Momentum is building — confirmation comes with a clean daily or weekly close above resistance.
Key Levels:
Support: $0.50
Resistance 1: $1.13
Resistance 2: $2.00
Structure: Higher high in place; watching for higher low confirmation
Break and hold above $1.13 will confirm bullish continuation toward higher targets.
