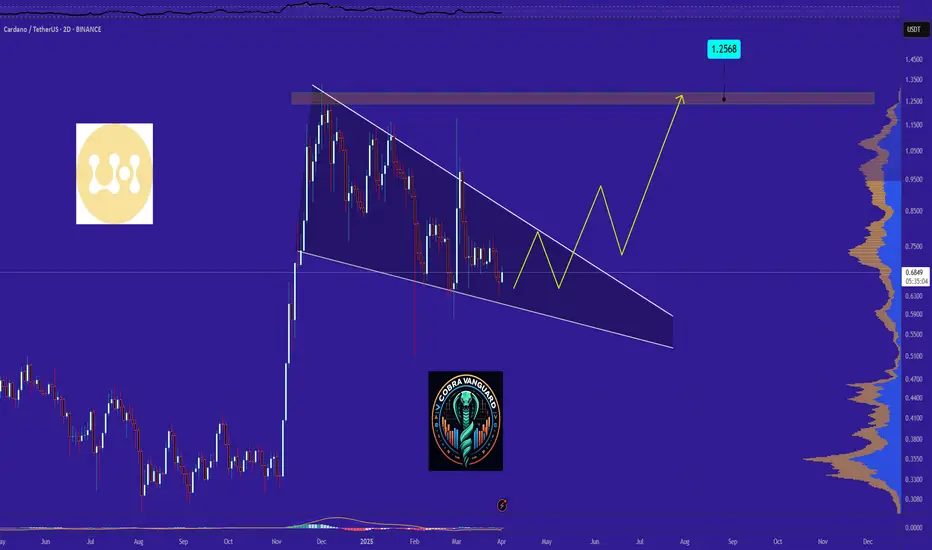
ADA road map !!!The ADA will increase 40 cents and reach to the top of the wedge in the coming weeks.
Give me some energy !!
✨We spend hours finding potential opportunities and writing useful ideas, we would be happy if you support us.
Best regards CobraVanguard.💚
_ _ _ _ __ _ _ _ _ _ _ _ _ _ _ _ _ _ _ _ _ _ _ _ _ _ _ _ _ _ _ _
✅Thank you, and for more ideas, hit ❤️Like❤️ and 🌟Follow🌟!
⚠️Things can change...
The markets are always changing and even with all these signals, the market changes tend to be strong and fast!!
ADAUST trade ideas

AS BEFORE WE LONGED AND GAPED OUR PROFITS ,THIS IS TIME WE SHORTHere is the set up,acc to rsi we are over sold atm its a short clean

ADA breaking a 15 day downtrendMonths of only downtrends and consolidation. We need to make our way higher before Donald The Pumpkin Trump starts talkikg again

ADA Poised for a Bullish Breakout? Key Levels to Watch!🔹 Current Market Structure: #ADA is moving sideways in an accumulation phase on the 1-hour timeframe, indicating potential strength for an upcoming bullish move.
🔹 Bullish Confirmation:
We are closely monitoring a breakout above the resistance level. A confirmed candle close above the accumulation zone with a successful retest would signal a strong buy opportunity.
🔹 Trading Plan:
🔹 Wait for a break and retest above the resistance.
🔹 Enter a long trade with proper risk management.
🔹 Target key resistance zones for potential profits.
🔹 What’s Your Take? Will #ADA break out or get rejected? Drop your thoughts in the comments!
🔹 Like, Comment & Follow for more real-time updates!

cardano bullish momentAfter the the recent price drop on most of the asset classes , i made my analysis and highlighted my key surpport zones where price is likely to respect and switch to an upward trajectory hence gaining a bullish momentum

ADAUSDT → Correction to the liquidity zone before the fall ↓BINANCE:ADAUSDT is in a bear market, under pressure. An exit from consolidation and a pullback with the aim of retesting the resistance (liquidity zone) before further decline is formed
The fundamental background for cryptocurrencies is extremely negative. Bitcoin on yesterday's manipulation related to the 90-day tariff break, which was later denied by the White House began to form “helicopters” and high volatility. As the market calms down, the price returns to the selling zone, which creates pressure for Cardano as well.
Technically, a false breakdown of 0.5 fibo is formed and the price is consolidating near the local support at 0.5800. The breakdown and consolidation of the price below 0.58 will provoke the continuation of the fall. A retest of the previously broken consolidation support at 0.6300 is possible.
Resistance levels: 0.63, 0.6661
Support levels: 0.581, 0.5092, 0.4564
The market structure is exclusively bearish. A False breakout of resistance or breakdown of 0.581 will provoke a further fall, but the level of 0.5092, if broken, will finally drive the coin into the zone of emptiness, which may lead the price to fall to 0.45- 0.42.
Regards R. Linda!

ADA retraces to key Fibonacci level with bullish structureOn the BINANCE:ADAUSDT 1W chart, the price has retraced to the 78.6 Fibonacci level after a strong bullish impulse and is now forming a higher low, keeping the overall market structure intact. The Ichimoku cloud (10, 20, 40, 10) remains far above the current price, confirming there is still bearish pressure in the short term, but this also creates space for a sharp move up if momentum shifts. The Trend Strength Index (20, 10) is deep in oversold territory, signaling weakness, while price action shows early signs of accumulation. The two recent lows have built up liquidity, suggesting a possible sweep before a continuation to the upside. Long positions below 0.52 with a stop under 0.32 and a target near 1.32 offer a favorable risk to reward setup, especially if lower timeframes confirm a shift in direction. This area may represent a key long term opportunity if the bullish scenario plays out.
Disclaimer: This content is for educational and informational purposes only. It does not represent financial advice or a recommendation to buy or sell any financial instrument. Trading involves risk, and you should only trade with money you can afford to lose.

ADAUSDT 0.5$ is strong enough to pump the price As we mentioned before we are looking for long from 0.5$ and now support hit and we can expect range market or rise at least here to our first target which is around 0.75$ to 1$.
DISCLAIMER: ((trade based on your own decision))
<<press like👍 if you enjoy💚

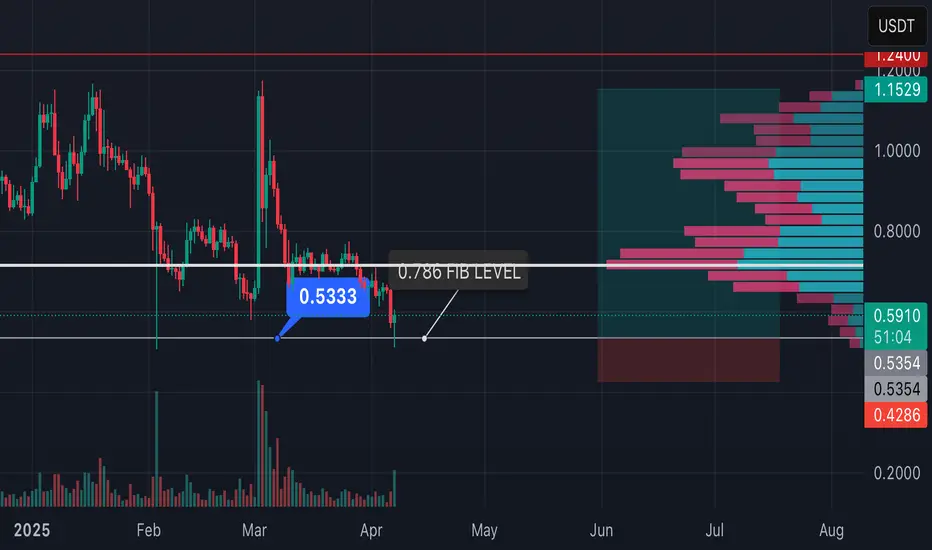
ADA We are going to do another 1XWe have the retracement level of 0.786 on the price of 0.5354 from here we are going to get another one next in a few months hold your positions and don’t be panic.
Cardano (ADA) Long using Lesson 15 MethodologyAlready first target was hit and moved stop loss to BE.
Lesson 15 Methodology:
1. Largest Down wave on support (could have buyers in there)
2. Place AVWAP at the beginning of the down wave
3. Wait for price to cross upwards the AVWAP and pull back to it.
4. Wait for a Plutus long signal where in this case it was a PRL
and up we go!
Now this huge pin with the enormous volume worries me for sellers but since we got 1st target and stop is at BE I will let it run.

ADAUSDT Drops, Bear Pressure on LHHi there,
ADAUSDT appears bearish on the M30 due to lower high pressure. The target is 0.5827, with a bias towards 0.5263. Monitoring will be required.
Happy trading and have a lovely weekend.
K.
Not trading advice.

ADAUSDT NEXT MOVESell after bearish candle stick pattern, buy after bullish candle stick pattern....
Best bullish pattern , engulfing candle or green hammer
Best bearish pattern , engulfing candle or red shooting star
NOTE: IF YOU CAN'T SEE ANY OF TOP PATTERN IN THE ZONE DO NOT ENTER
Stop lost before pattern
R/R %1/%3
Trade in 5 Min Timeframe, use signals for scalping

ADAUSD - ANALYSIS👀 Observation:
Hello, everyone! I hope you're doing well. I’d like to share my analysis of Cardano (ADA-USD) with you.
Looking at the Cardano chart, I expect that if we close the weekly candle above 0.622, the price could increase towards the target of 0.8939. However, if the weekly candle closes below 0.622, I anticipate further price decline with a target of 0.4570.
📉 Expectation:
Bullish Scenario: Weekly close above 0.622 → price moves towards 0.8939.
Bearish Scenario: Weekly close below 0.622 → price declines towards 0.4570.
💡 Key Levels to Watch:
Support: 0.4570
Resistance: 0.622, 0.8939
💬 What do you think about Cardano (ADA-USD) this week? Let me know in the comments!
Trade safe

Cardano (ADA) is on the verge of an 80% surge (1D)Despite all the positive news, it couldn’t maintain its bullish trend, as seasoned whales typically don't enter the market at the end of bullish waves.
The zone we’ve highlighted is where we believe whales will enter Cardano. Due to heavy buying pressure, the price could experience a 50% to 80% surge.
From the point marked with the green arrow on the chart, Cardano’s bullish phase has begun. It appears to be forming an expanding/diagonal/symmetrical triangle.
We are looking for buy/long positions in the green zone, where the hypothetical wave F might come to an end.
Targets are marked on the chart.
A daily candle closing below the invalidation level will invalidate our buy outlook.
For risk management, please don't forget stop loss and capital management
When we reach the first target, save some profit and then change the stop to entry
Comment if you have any questions
Thank You

Bearish pressureADA/USDT – Price Action Analysis
On the 1-hour timeframe, price has been following a clear downtrend, respecting a descending channel structure. After reaching the lower boundary, sellers lost some momentum, and price started to form a rising wedge, typically seen as a bearish continuation pattern in such contexts.
Currently, price is testing a key confluence zone:
The upper boundary of the wedge
The descending trendline resistance
And also sitting below the dynamic resistance of the 200 EMA.
From a price action perspective:
Bullish candles are showing limited strength and upper wicks indicate selling pressure.
A confirmed breakdown below the wedge support could lead to further downside towards the previous demand area around 0.6550 - 0.6340.

Cardano is completing its third recurring pattern.Each pattern begins with a sharp upward pump, followed by a peak phase (blue), a decline phase (yellow), and finally a recovery phase (purple). Currently, we appear to be at or near the end of this pattern, which opens up the potential for another leg up.
📉 On the weekly StochRSI, we are in the oversold zone, suggesting there’s room for a move higher.
📊 The Accumulation/Distribution indicator shows a bullish divergence, which is another positive signal.
💡 On the MACD, selling pressure is fading, indicating Cardano may be gearing up for a breakout in the coming weeks.
However, it's important to note that Cardano might continue consolidating for some time and could even dip as low as $0.50.
🔑 Cardano is unlikely to rally without a move from Bitcoin — either a breakout or at least sideways consolidation. In the latter case, Bitcoin dominance would need to drop, which we might start seeing in the next few weeks.
Lastly, macro factors will also play a role. But as long as nothing major goes wrong, we could start seeing higher prices for ADA by summer.

ADA Spot Trade Setup – Support Level OpportunityCardano (ADA) is currently sitting at a key support zone, presenting a solid risk-to-reward long opportunity if bulls can hold the level.
🛠 Trade Plan:
Entry: $0.63 – $0.70
Take Profit Targets:
$0.78 – $0.84 (First Target)
$0.96 – $1.02 (Extended Target)
Stop Loss: Just below $0.58

Breaking: $ADA Set for 100% Surge Amidst Launching of VeridianCardano the proof-of-stake blockchain platform that says its goal is to allow “changemakers, innovators and visionaries” to bring about positive global change, is set to breakout of a bullish symmetrical triangle with a 100% surge in sight amidst The Cardano Foundation launching "Veridian", an open-source identity wallet for secure, verifiable credentials on iOS and Android.
The asset is already up 2.24% despite the general crypto and stock market turmoil that saw over $1.5 trillion wiped out from US stock market at open today and over $2.85 trillion wiped out from the US stock market yesterday.
For Cardano ( CRYPTOCAP:ADA ), a breakout above the ceiling of the symmetrical triangle could catalyze the bulls to step in and push the asset to new highs. Similarly, should CRYPTOCAP:ADA fail to pull that stunt and selling pressure increases, CRYPTOCAP:ADA might cool-off in the $0.50 region.
Cardano Price Live Data
The live Cardano price today is $0.660668 USD with a 24-hour trading volume of $868,773,182 USD. Cardano is up 6.97% in the last 24 hours. The current CoinMarketCap ranking is #9, with a live market cap of $23,300,460,393 USD. It has a circulating supply of 35,268,011,575 ADA coins and a max. supply of 45,000,000,000 ADA coins.
ADAUSDT NEXT MOVE Sell after bearish candle stick pattern, buy after bullish candle stick pattern....
Best bullish pattern , engulfing candle or green hammer
Best bearish pattern , engulfing candle or red shooting star
NOTE: IF YOU CAN'T SEE ANY OF TOP PATTERN IN THE ZONE DO NOT ENTER
Stop lost before pattern
R/R %1/%3
Trade in 5 Min Timeframe, use signals for scalping

ADA - Bearish Reversal Setup from Fair Value Gap🚀 ADAUSDT - 1H Chart Analysis 🚀
📊 Current Market Structure:
ADA is moving within a rising channel 📈, approaching a key resistance zone where a Fair Value Gap (FVG) is present. This area aligns with a significant Fibonacci retracement zone, making it a strong potential reversal point.
📌 Technical Insights:
🔹 Price is trading inside a well-defined bullish channel.
🔹 Approaching a major supply zone with previous reaction points.
🔹 Bearish rejection is expected in this area, leading to a potential drop.
📉 Trade Expectation:
A reaction from the FVG could lead to a downward move, as highlighted by the red arrows. If price confirms a rejection, a bearish shift in structure could occur, offering short opportunities.
⚠️ Risk Management Tip: Always wait for confirmation before acting on a setup. Managing risk effectively is key to long-term success!
📢 What do you think? Will ADA respect the FVG or push higher? Share your thoughts! 💬📉🚀

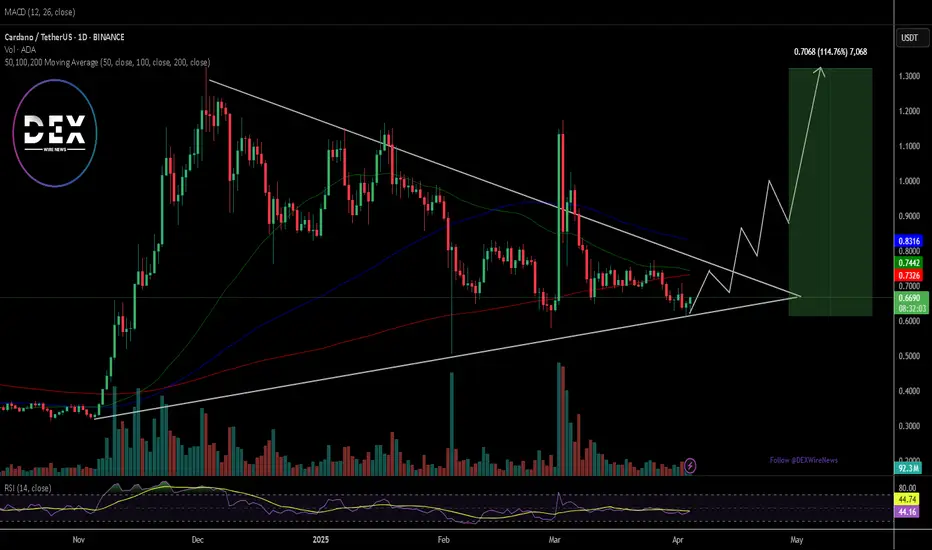
Can we be optimistic that this will come true?( road to $1 )As you can see, the price has now formed an ascending wedge or ascending flag , which is promising. The price could rise to $1 after breaking this wedge...
Give me some energy !!
✨We spend hours finding potential opportunities and writing useful ideas, we would be happy if you support us.
Best regards CobraVanguard.💚
_ _ _ _ __ _ _ _ _ _ _ _ _ _ _ _ _ _ _ _ _ _ _ _ _ _ _ _ _ _ _ _
✅Thank you, and for more ideas, hit ❤️Like❤️ and 🌟Follow🌟!
⚠️Things can change...
The markets are always changing and even with all these signals, the market changes tend to be strong and fast!!
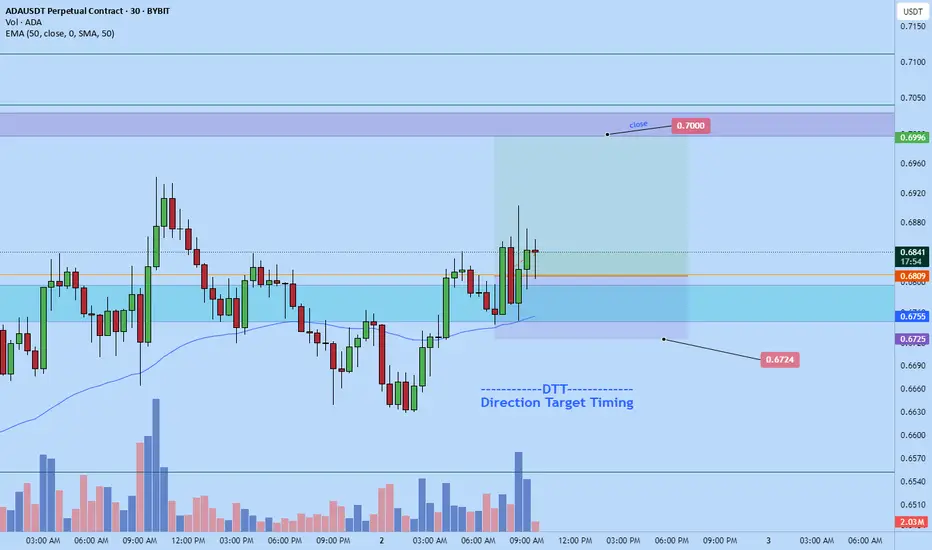
ADA long to $0.7Gm.
I just opened a long position on ada.
I expect market to up a bit before Trump liberation a day speech. Trend is also bullish.
Time sensitive !
Dtt strategy applied
ADA - Bearish Rejection from Fair Value Gap (FVG)?This 4-hour chart of ADA/USDT shows price making a strong recovery after a significant drop. However, it is now approaching a key resistance area—a Fair Value Gap (FVG) near the 0.618-0.65 Fibonacci retracement levels.
Here’s the potential setup:
🔹 FVG Resistance: Price is entering a liquidity zone where sellers might step in.
🔹 Possible Double Top Formation: A rejection at this level could lead to a bearish reversal, forming a distribution pattern before dropping.
🔹 Bearish Continuation? If the FVG acts as resistance, ADA could resume its downtrend, targeting lower support zones.
Will this resistance hold, or will ADA break through and continue higher? Drop your thoughts below! 🔥📉
