Will it test 0.75/0.50Will it hold0.75, get to 0.50 or surge to 1.00
It was surging after US news, everything is crushing.....we need some vonfirmation or consolidation
It is what it is ...If we get an amazing bull market we need to wait to see how US taxes are affecting crypto
ADAUST trade ideas


Just In: Cardano ($ADA) Broke Out of a Falling Wedge Surge 10% The renown altcoin that is known to move in tandem with CRYPTOCAP:XRP saw a noteworthy uptick in price with the native asset surging 10% amidst breaking out of a falling wedge pattern. With the RSI at 57 are we going to witness a lip to the $1 pivot or beyond?
Presently, CRYPTOCAP:ADA is trading within the trendline of the wedge a small thrust above the resistance could be the catalyst CRYPTOCAP:ADA needs to cement a move to $2.
What Is Cardano (ADA)?
Cardano is a proof-of-stake blockchain platform that says its goal is to allow “changemakers, innovators and visionaries” to bring about positive global change. The open-source project also aims to “redistribute power from unaccountable structures to the margins to individuals” — helping to create a society that is more secure, transparent and fair.
Cardano Price Live Data
The live Cardano price today is $0.936263 USD with a 24-hour trading volume of $5,369,546,196 USD. We update our ADA to USD price in real-time. Cardano is up 8.62% in the last 24 hours. The current CoinMarketCap ranking is #8, with a live market cap of $32,968,087,133 USD. It has a circulating supply of 35,212,423,444 ADA coins and a max. supply of 45,000,000,000 ADA coins.
Cardano 7X Trade-Numbers (1330% Potential)I would love to have a better entry here but better late than never. When in doubt, reduce leverage.
The falling wedge pattern here reveals the end of the correction. The bullish breakout reveals the resumption of the bullish move. A bullish move means higher highs and higher lows.
Cardano is set to grow for months and months and months.
We are going up.
You can find the targets for this chart setup listed below:
_____
ADAUSDT LONG 7X (PP: 1330%)
Targets:
TP1: $1.0114
TP2: $1.1499
TP3: $1.3262
TP4: $1.5207
TP5: $1.6410
TP6: $1.8354
TP7: $2.1502
TP8: $2.6594
Adjust all settings to your own liking.
_____
Good luck. Thank you again for your continued support.
Remember, you deserve the best.
The Cryptocurrency market is healthy, new and young.
Crypto is here to stay.
This is only the beginning.
The best is yet to come.
Namaste.

Cardano Ultra-Bullish With 100% Growth Within 2 DaysThere you have it my dear friends... I told you that the low was in and this is confirmed now, without a shadow of doubt, based on current price action.
The low happened in early February 2025. Boom! And we win.
Told ya! Over and over, again and again.
And this is awesome and great news, why?
Because it means we are on, we are bullish, we are super bullish and we are set to experience the biggest growth ever... "March 2025 and beyond."
Trading volume is really high today which confirms that this is a real move.
All the bears are very likely going crazy right now and that's ok, and it is normal because the market is breaking out with the biggest force ever, period.
Pay attention to the Master of the charts, because we are going up.
Crypto is going up.
Bitcoin is going up.
Cardano is going up.
The Cryptocurrency market is set to experience the biggest growth phase since 2021.
Thanks a lot for your continued support.
If you trusted and followed, I am sure you are doing great.
If you were bearish, I feel sorry for you... Not! Get in line, get in now and prepare for massive growth, it is not too late.
Namaste.


ADAUSDT - buy cycle Adausdt
Buy cycle
Tp@1.1361
% bubble
Price is in a negative bubble and the fair value in midterm is 1.1361
Spot Trading plan:
Entry 1: 0.7953
Entry 2: 0.6817
Entry 3: 0.5681
TP@1.1361

Price Reactions to Drawn ZonesThe suggested positions are only applicable after receiving the necessary confirmations and do not represent definitive trading points. It is understood that entry and exit points may be updated during the trade. Please note that this is solely an analysis and not a financial or trading recommendation. The responsibility for any risks taken lies with the readers.
Wishing you success.

ADA And the Crypto ReserveCardano is forming a bull flag after coming back to the .6 area and capitulating up to my previous addressed 1.17 resistance. I think the $.8032 will provide support and a possible bounce point if not there the .7865 support looks interesting.
ADA is not moving in tandem with BTC at the moment bc bitcoin isn't in the talks for fridays crypto summit at the white house... i have been saying that i see 1.49 iin the near future for ADA.....Is it this weekend???

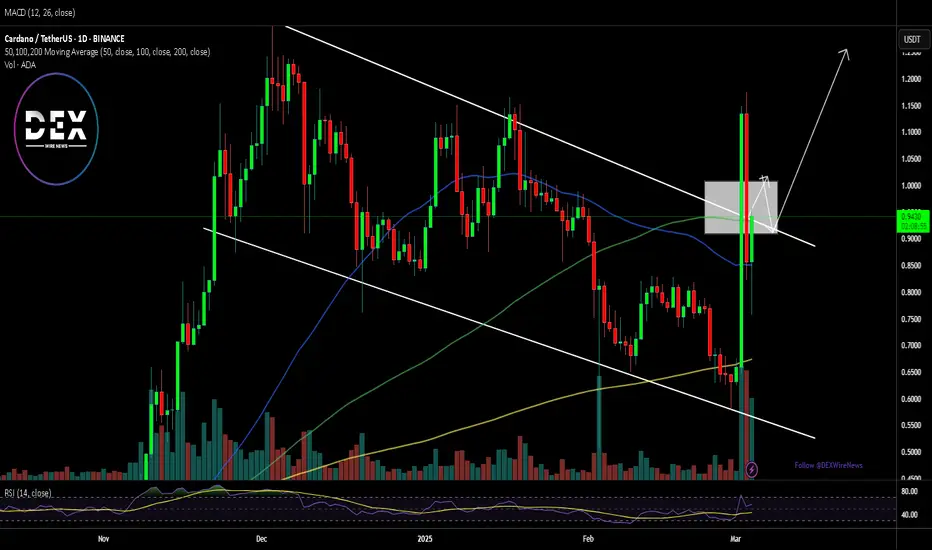
Cardano Update: Bullish MA200 Daily Long-Term & Short-TermLet's have a closer look at Cardano, ADAUSDT; look at the volume, what do you see?
It is not only yesterday's rise that is out of proportion with the rest of the days, early February and mid-November 2024 are also mainly green. Really high volume, always on green days. Notice how low the volume bars are on bearish (red) days.
After a strong bullish breakout, a reactive move, there is always a retrace. This retrace should be short-term and short-lived. That is, prices move lower shortly before additional growth. Whatever happens, this retrace will always end as a higher low compared to the start of the bullish jump. This means that Cardano is going up. Going up long-term and set to continue to grow on the short-term. But the market never moves straight up in a signal week, month or day.
If an advance is set to last only 30 days, we can definitely see a parabolic rise but, for this to happen, we would have a strong and long consolidation phase preceding the move. The best example is recent, late 2024. Consolidation happened between August and October 2024 and then a massive jump. All those months building up momentum and then a move with massive force developed. Now it is different because we won't see a simple bullish jump, we are set to experience long-term growth. Say Cardano grows for 8 months or more, until late 2024. Consider a new All-Time High around November 2025. Can be sooner or can be a bit later but here we are developing a map.
The important point is to focus on the long-term. Ignore the noise, ignore the short-term. The best example is Bitcoin, it was weak and bearish for six days, all loses were recovered in a matter of hours. This is how a volatile and young market behaves. Prepare for more.
Cardano is good. The chart reveals a bullish bias and the price is nice and strong. MA200 daily worked as support and yesterday's breakout recover EMA55, the action is happening above. A break and close above EMA55 confirms growth potential mid-term. The trading above MA200 daily means that it is confirmed, we are bullish on the long-term.
The bullish bias was confirmed in November 2024. The recent drop was a test of a resistance level turned support. The test was a success, MA200 holds. With this confirmation done and over, we are green and up we go.
Namaste.

Do you see a triple top or what? Hm.. Not sure how to interpret it. There is a tripple top and lower high... Oh dear.. express elevator to.. ?

ADA/USDT at Decision Point – Major Move Incoming!ADA/USDT is testing a major resistance zone after retesting the 100 EMA and bouncing from the rising support line. The price remains in a long-term symmetrical triangle, with the resistance trendline as a key breakout level.
The Stochastic RSI is recovering from oversold levels, indicating potential bullish momentum. A breakout above resistance could trigger a strong uptrend continuation, while rejection may lead to a pullback toward support.

ADA last chance to get in? Are you allocated into ADA? Why not? It just pumped almost 100% yesterday because of Trumos Twitter Tweet. Imagine what happens when the general public finds out this. Or will it never happen?
Was this your last chance to get in cheap?? We just touched the 78.6 fib... Are we going up?

ADAUSDT Breakout Incoming or Another Fakeout?Yello, Paradisers! Are we about to see ADAUSDT explode, or is this just another trap for impatient traders? Let’s break it down!
💎ADAUSDT is looking solid after completing a proper double zig-zag corrective phase. The key to confirming the next move lies in breaking and closing a candle above the resistance level. If this happens, it significantly increases the probability of a bullish breakout. Why? Because ADA is still trading in the discount range of a descending channel, and we’re also seeing bullish divergence—a strong confluence signal for upside momentum.
💎However, if ADA pulls back or retraces further, the smartest play is to wait for inducement. Ideally, we want to see bullish structures form, such as a bullish I-CHoCH or well-known bullish patterns like a W formation or inverse head and shoulders on lower timeframes. If those confirmations appear, the probability of a bullish move shifts in our favor.
💎On the flip side, if ADA falls sharply or closes a candle below the support zone, it would invalidate our bullish scenario. This would likely extend the corrective wave into a deeper structure, signaling that it’s best to stay patient and wait for clearer price action.
🎖 Bottom line? The market is setting up for a major move—either a powerful breakout or a deeper retracement. Only those who wait for the right confirmations will come out on top. Stay disciplined, Paradisers! 🚀
MyCryptoParadise
iFeel the success🌴

ADA Bullish Breakout Incoming? Key Levels to Watch! Overview:
#ADA has been following a perfect harmonic pattern and has now completed it. On the 1-hour timeframe, a bullish divergence has formed, signaling potential upward momentum. But is it time to go long? Let's break it down.
Key Confirmation:
🔹 Harmonic pattern completion
🔹 Bullish divergence on 1H timeframe
🔹 Price respecting key support levels
🔹 The final confirmation? A break and close above resistance!
Trading Plan:
🔹 Entry: Wait for a 1-hour candle to close above resistance
🔹 Targets: TP-1: 0.78 and TP-2: 0.8250
🔹 Stop-Loss: Below recent swing low for proper risk management
What’s Your Take?
Do you think #ADA will break out or face rejection? Share your thoughts in the comments! Let’s discuss and trade smartly.
Follow for more trade ideas!

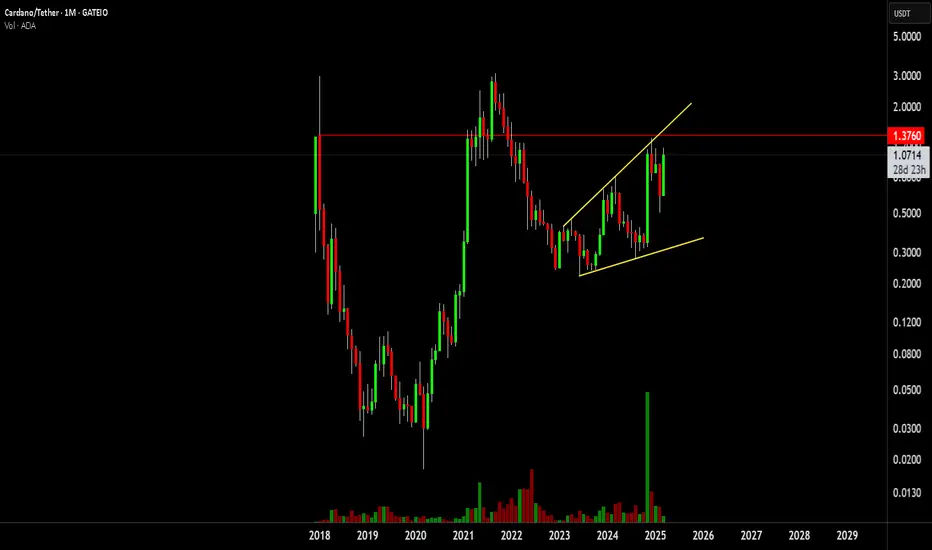
Cardano Long-Term: Crypto Strategic ReserveCardano grew by 18,352% between March 2020 and August 2021. The highest volume came in on the third wave and we ended with a truncated five.
Seeing this performance in the last bull-market, we can aim high. Instead of being too conservative and making the same mistake as always, aiming too low, let's aim higher because we know that Cryptocurrency has huge potential, it is new and young.
From current price to $10.5 we are looking at ~895% potential. From the August 2024 bottom to the same target we have some 3,770%. I think that with the current size Cardano has now such total growth might be reasonable, but the market is not reasonable. We don't know the meaning of a "Crypto Strategic Reserve." We don't know what it means, in turns of prices and numbers, many nations buying Crypto. We can end up with a bull-market that is hundreds of times stronger than anything we've seen before. In this case, all projections would breakdown and prices would go off the chart. I hope this happens.
Since we cannot predict the unpredictable nor calculate based on assumptions, let's go with what we have. What is the chart saying, what are the potential targets and how will the bull-market unravel. We want answers to those questions.
The targets are the ones seen on the chart.
The minimum target for a new ATH based on conservative and standard calculations would equal $4.86. Short-term targets that will be hit within the next three months go as follows: $1.33, $1.66, $1.83, $2.00, $2.22, $2.66 & $3.49.
A strong target and projection sits at $7.77 and a $10.58 is the next All-Time High if we have a great bull-market based on standard projections. The ultra-bullish scenarios we welcome and enjoy them if they show up but they are beyond this chart.
The main support range after the Trump Pump sits between $0.9116 and $1.0094. If it goes lower, we have $0.8138 but I don't think lower is possible. This is for support if the market decides to shake. Remember, it is a long bull-market so there will be plenty of time for volatility to show up. Whatever happens, remember the bigger picture; we are going up.
I always liked Cardano and I share many analysis and many charts so it is great to see that we have Trump's support. Our future is bright. If we are smart, we buy and we hold.
Don't just think about next year or next month, consider 10 years into the future, maybe even 20 years... Think of the big tech companies. One can become rich with one project, one coin. Just as the old people from the 70s and 80s. We are approaching the bull-market of a new generation. No limits now, no barriers, no filters; everybody can join.
Cryptocurrency, the stock market for the people.
Thanks a lot for your continued support.
Namaste.

ADA Perfect Bullish Flag pattern setup to $2ADA Perfect Bullish Flag pattern setup to $2. Fundamentals and chart working nicely together to confirm a bullish flag pattern on ADA. Lots of opportunities to day/swing trade this move to $2.

$ADA Ascending Broadening WedgeCRYPTOCAP:ADA Ascending Broadening Wedge rejected at local resistance below long term resistance
ADA - Giant Cup & Handle Pattern Just Like ETH MartyBoots here , I have been trading for 17 years and sharing my thoughts on BINANCE:ADAUSDT here.
.
BINANCE:ADAUSDT is looking beautiful , very interesting chart for more upside
and is now added to the USA Strategic Reserve
Do not miss out on BINANCE:ADAUSDT as this is a great opportunity
ADA Strategic Reserve
Watch video for more details

Important support and resistance zone: 1.0302 ~ 1.2214
Hello, traders.
If you "Follow", you can always get new information quickly.
Please click "Boost".
Have a nice day today.
-------------------------------------
(ADAUSDT 1W chart)
The key is whether it can receive support at the important support and resistance zone and rise to around 1.3678.
If not, whether it can support around 0.8836 is important.
-
(1D chart)
The key is whether it can be supported in the Fibonacci ratio range of 0.5(1.0302) ~ 0.618(1.2214).
If not, whether it can be supported in the vicinity of 0.8451-0.8836 is important.
The reason is that the price must be maintained above the M-Signal indicator on the 1D, 1W, and 1M charts to continue the uptrend.
-
Thank you for reading to the end.
I hope you have a successful trade.
--------------------------------------------------
- Big picture
I used TradingView's INDEX chart to check the entire range of BTC.
(BTCUSD 12M chart)
Looking at the big picture, it seems to have been following a pattern since 2015.
In other words, it is a pattern that maintains a 3-year bull market and faces a 1-year bear market.
Accordingly, the bull market is expected to continue until 2025.
-
(LOG chart)
Looking at the LOG chart, we can see that the increase is decreasing.
Accordingly, the 46K-48K range is expected to be a very important support and resistance range from a long-term perspective.
Therefore, we do not expect to see prices below 44K-48K in the future.
-
The Fibonacci ratio on the left is the Fibonacci ratio of the uptrend that started in 2015.
That is, the Fibonacci ratio of the first wave of the uptrend.
The Fibonacci ratio on the right is the Fibonacci ratio of the uptrend that started in 2019.
Therefore, this Fibonacci ratio is expected to be used until 2026.
-
No matter what anyone says, the chart has already been created and is already moving.
It is up to you how to view and respond to it.
Since there is no support or resistance point when the ATH is updated, the Fibonacci ratio can be appropriately utilized.
However, although the Fibonacci ratio is useful for chart analysis, it is ambiguous to use it as a support and resistance role.
The reason is that the user must directly select the important selection points required to create the Fibonacci.
Therefore, it can be useful for chart analysis because it is expressed differently depending on how the user specifies the selection point, but it can be seen as ambiguous for use in trading strategies.
1st: 44234.54
2nd: 61383.23
3rd: 89126.41
101875.70-106275.10 (when overshooting)
4th: 134018.28
151166.97-157451.83 (when overshooting)
5th: 178910.15
-----------------

red resistance zoneAnalysis 🚨
CRYPTOCAP:ADA is testing the red resistance zone 🔴. If the breakout is successful, the first target will be the green line level 🟩!
🎯 Target:
✅ Green line level

ada buy limit midterm"🌟 Welcome to Golden Candle! 🌟
We're a team of 📈 passionate traders 📉 who love sharing our 🔍 technical analysis insights 🔎 with the TradingView community. 🌎
Our goal is to provide 💡 valuable perspectives 💡 on market trends and patterns, but 🚫 please note that our analyses are not intended as buy or sell recommendations. 🚫
Instead, they reflect our own 💭 personal attitudes and thoughts. 💭
Follow along and 📚 learn 📚 from our analyses! 📊💡"

ADAICT Perspective (Smart Money Concepts)
1. Liquidity Zones & Smart Money Manipulation:
The "stopped" level (~$0.5960) could indicate a liquidity grab (Stop Hunt), where smart money clears weak hands before a potential rally.
Price might have swept sell-side liquidity before shifting structure.
2. Premium & Discount Pricing:
The current price (~$0.66) is near the discount zone of the overall bullish range.
Smart money could be accumulating positions before pushing price toward the glitch target (~$2.4685).
3. Order Blocks & Imbalances:
There is a fair value gap (FVG) in the price action near $2.46.
If the market seeks to rebalance inefficiencies, price could rally toward this level.
4. Market Structure Shift (MSS):
A break in structure (BOS) above recent highs would confirm bullish continuation.
---
Elliott Wave Perspective
1. Wave Count Possibility:
Price appears to be starting a new impulse wave (Wave 1) after a major correction.
The previous decline likely formed an ABC correction.
2. Projected Wave Structure:
Wave 1: The initial bullish push from lows.
Wave 2: A corrective retracement (possibly the recent "stopped" area).
Wave 3: The strongest wave, targeting the glitch level (~$2.46).
Wave 4: A minor pullback.
Wave 5: Potential push toward $3.09+.
3. Confluence with ICT:
If smart money is accumulating, Wave 3 could align with an explosive bullish move.
The glitch target at $2.46 could be the Wave 3 peak before correction.
---
Conclusion
The $0.5960 - $0.66 zone could be a smart money accumulation area.
A bullish move toward $2.46 - $3.09 aligns with Wave 3 completion.
Watch for liquidity grabs, order blocks, and BOS confirmations for entry validation.
