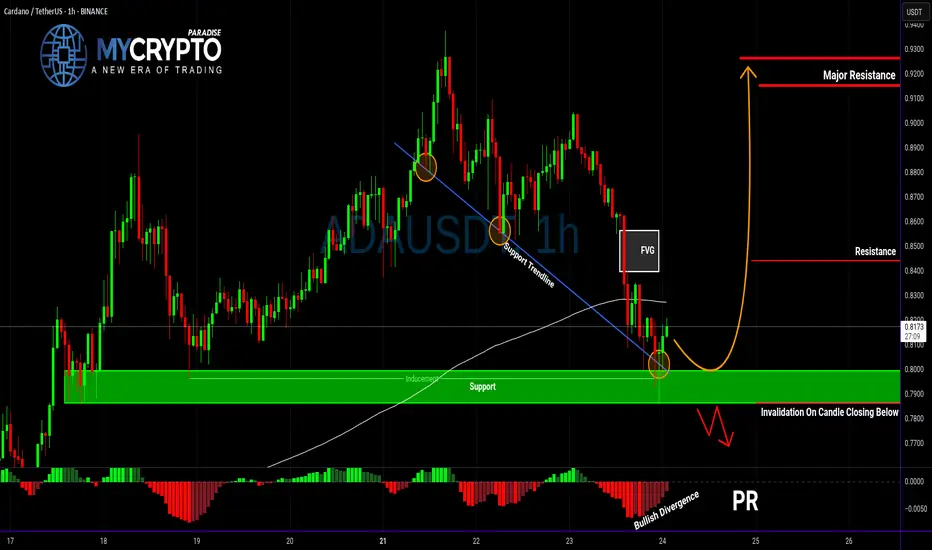
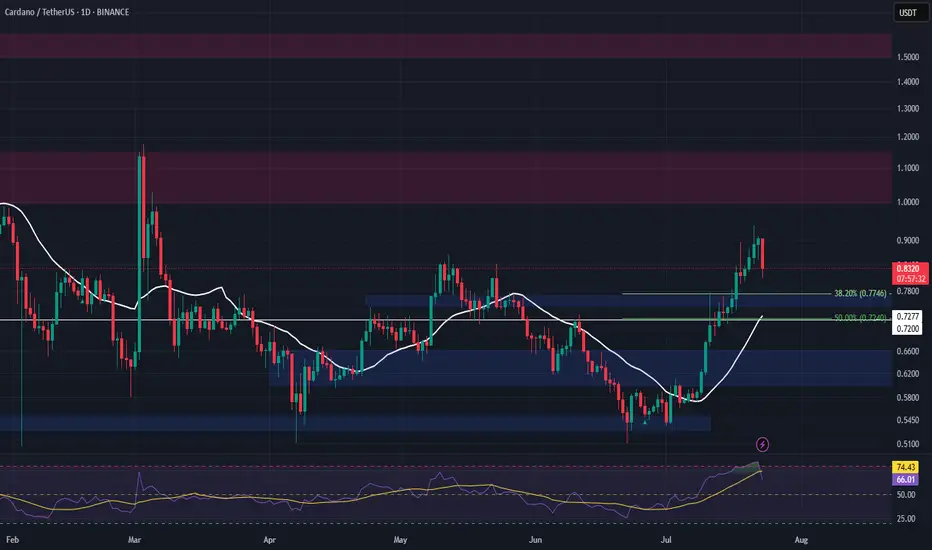
ADA About to Explode or Collapse?Yello Paradisers — is ADA gearing up for a breakout, or are we walking straight into a bull trap? After the recent pullback, the market is throwing mixed signals, but this setup is becoming too important to ignore. Here’s what we’re seeing right now on ADAUSDT.
💎ADA is currently showing positive signs of strength after a solid retracement. Current support zone is not only a historical price pivot, but it's also aligned with a supportive trendline, the 200 EMA, and a developing bullish divergence on the chart. All these factors combined are increasing the probability of a short-term bounce — but that doesn't mean we go in blind.
💎For aggressive traders, entering at the current price might make sense, especially if you’re targeting the first resistance level. However, it’s important to note that this entry offers a relatively limited reward compared to the risk — roughly a 1:1 risk-reward ratio — so it’s crucial to size your position accordingly and keep tight control over your stop loss.
💎If you're looking for a cleaner setup with a better risk-to-reward profile, patience is key. A more favorable scenario would be waiting for a proper pullback and a confirmed retest of the support zone. Ideally, you want to see a strong bullish candle at the support level to signal continuation — that’s when the setup shifts from average to high-probability.
💎But be cautious. If the price breaks down and closes a candle below our support zone, the entire bullish idea becomes invalid. In that case, it’s much wiser to step back and allow the market to develop more structure before re-engaging. Forcing trades in uncertain conditions is where most traders lose, and we don’t want to be part of that crowd.
🎖Strive for consistency, not quick profits. Treat the market as a businessman, not as a gambler. Be patient, Paradisers — only those who follow structured strategies and risk management will thrive in the long run.
MyCryptoParadise
iFeel the success🌴
ADAUST trade ideas
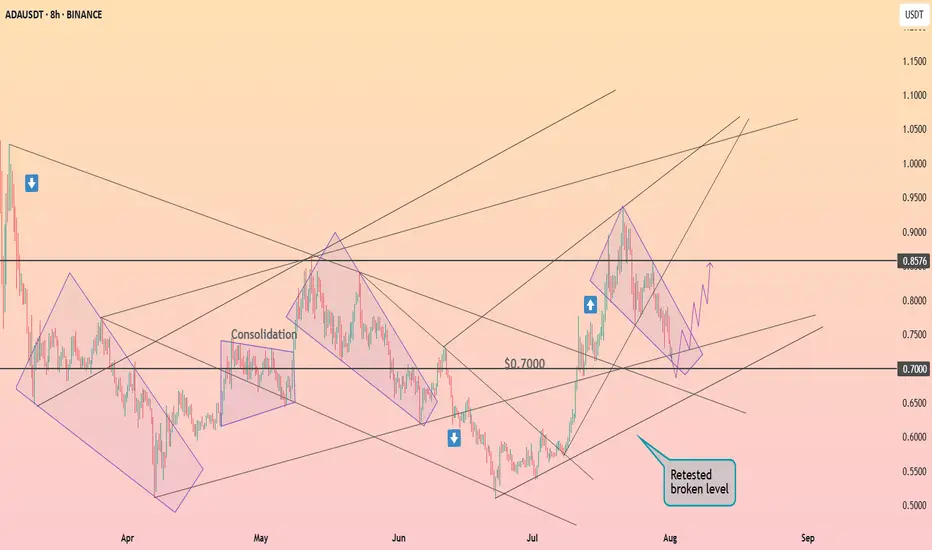
Cardano is forming the falling wedge ┆ HolderStatBINANCE:ADAUSDT is testing the $0.70 level after a clean breakout from previous consolidation. The current retracement channel indicates a controlled pullback, likely to flip into bullish continuation if $0.70 holds. Watch for a move toward $0.8576 once the pattern breaks upward.
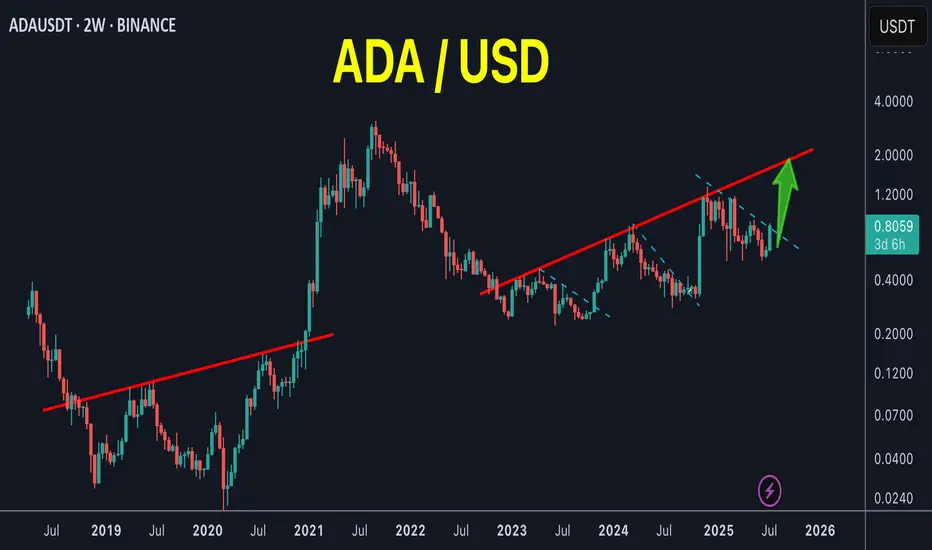
ADA Monthly Buying Opportunity As per my analysis ADA is showing buying opportunity in monthly chart. I hope it will return max 50% of investment in coming months. Trend is bullish, Monthly volume is above the average volume, golden level support. Do your own research before taking any risk.

ADAUSDT - Buy or Regret!As clear and simple as the chart is… the target is just as clear and reliable.
ADA is showing strong bullish structure on the 3-day chart — breaking above the red trendline with a successful retest, and also breaking above the 100 EMA.
The blue trendline represents a strong hidden resistance level that many traders are overlooking.
The upside move is likely to end around the 0.786 Fibonacci level, which intersects with this blue trendline — in the $1.50–$1.70 range.
A strong project. A fundamentally sound coin that respects technical analysis.
A logical and high-probability target.
Best regards Ceciliones🎯

Inside day breakoutYesterday was an inside day. On the daily chart it is breaking out, pulled back to 50% and supported by 200ma + 20ma. Ascending triangle supported by 20ma above 200ma into the Asian session. Looking to hold till close

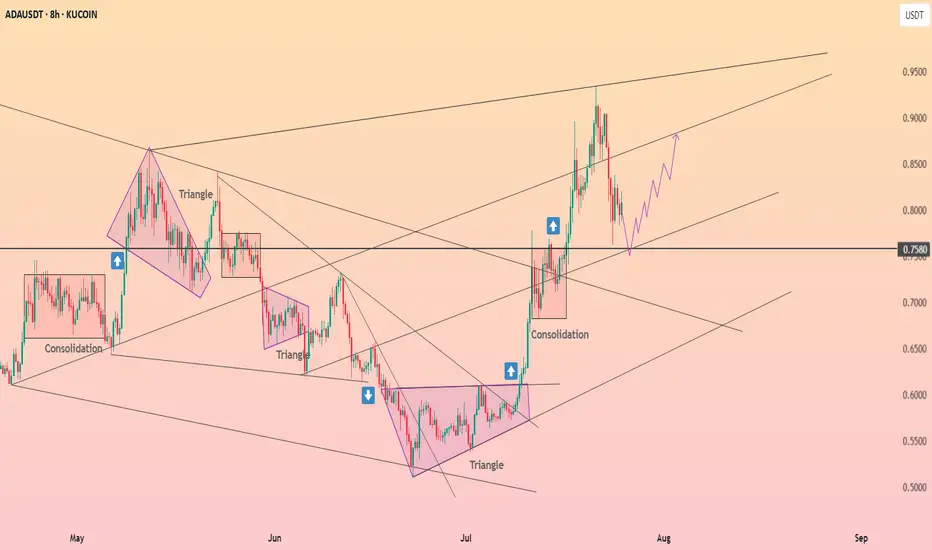
ADA (repeat the pattern)ADA /USDT
ADA keeps repeating its old patterns as it’s clearly obvious in my chart
Breakout is going on lower time frames
Looks like an easy 2X
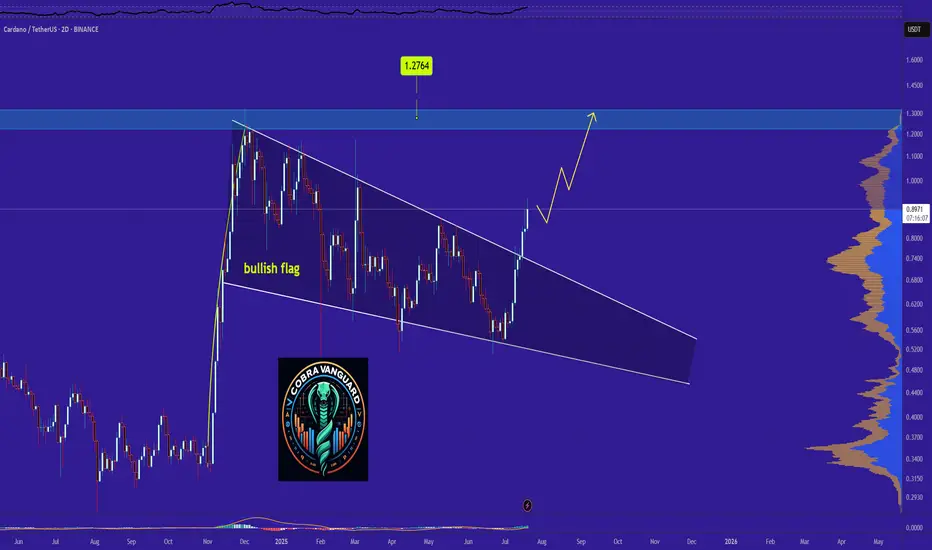
Why ADA Remains Bullish and Its Next Potential Move !The pattern has broken, and now I expect the price to rise to $1.27 . AB=CD.
Give me some energy !!
✨We spend hours finding potential opportunities and writing useful ideas, we would be happy if you support us.
Best regards CobraVanguard.💚
_ _ _ _ __ _ _ _ _ _ _ _ _ _ _ _ _ _ _ _ _ _ _ _ _ _ _ _ _ _ _ _
✅Thank you, and for more ideas, hit ❤️Like❤️ and 🌟Follow🌟!
⚠️Things can change...
The markets are always changing and even with all these signals, the market changes tend to be strong and fast!!
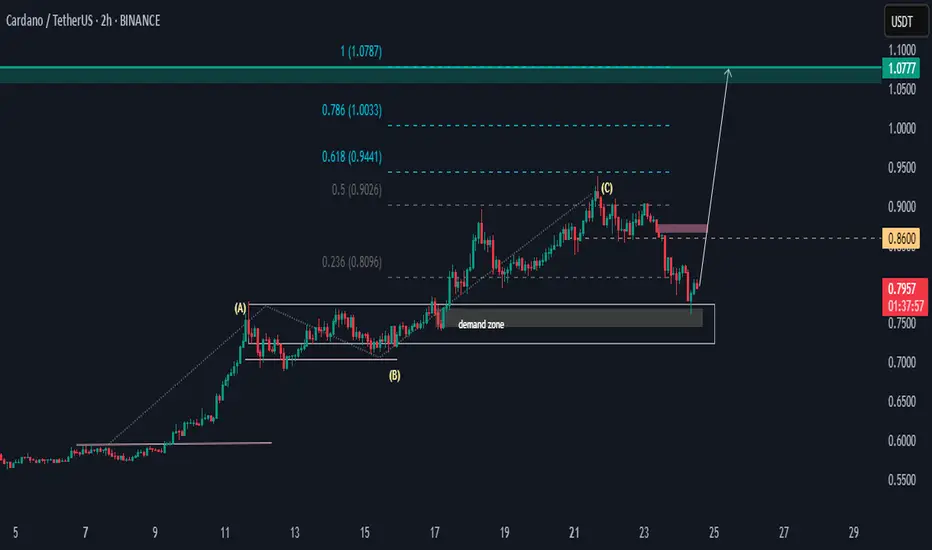
ADAUSDT SND Setup.Hello,
ADAUSDT has the potential to rally from the demand zone of 0.75 to 0.86 before rising above the high of point (C). We have two price targets, with a bias toward 1.0777.
If the price falls below the demand zone, then the setup will be invalid. A generic SND momentum flow analysis.
Happy Trading
Khiwe.
Cardano held above $0.76 ┆ HolderStatBINANCE:ADAUSDT is compressing under $0.44 with support from $0.418. Breakout from wedge structure may target $0.462. If $0.418 breaks, downside risk opens to $0.40. Watch for volatility.
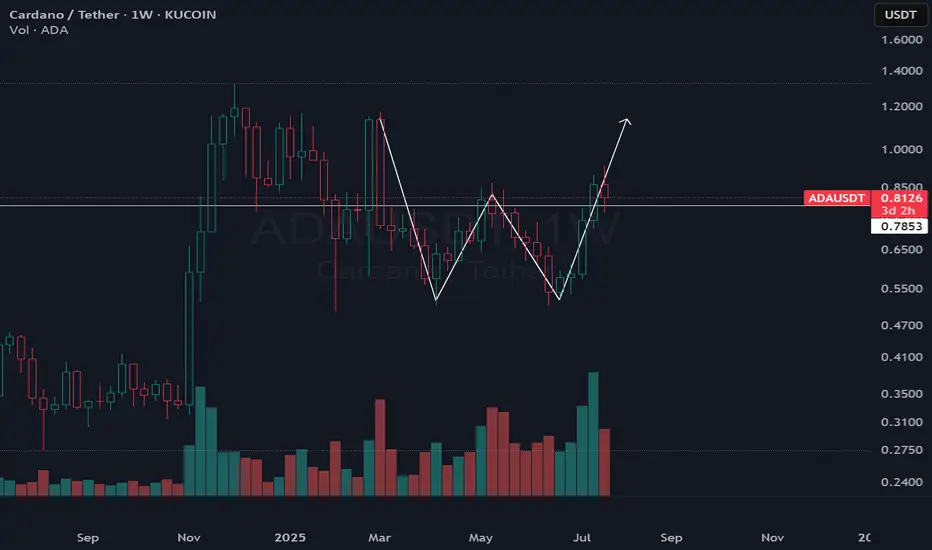
CardanoAda usdt Daily analysis
Time frame daily
Risk rewards ratio >3 👈👌
Double bottom pattern has been created

CardanoAda usdt Daily analysis
Time frame 4hours
Risk rewards ratio >4.3
Target =1.15$
Cardano is the Valuable asset in crypto market
Ada ready for 1.1According to my market analysis, Cardano is also ready to complete its pattern and pump towards $1.1.
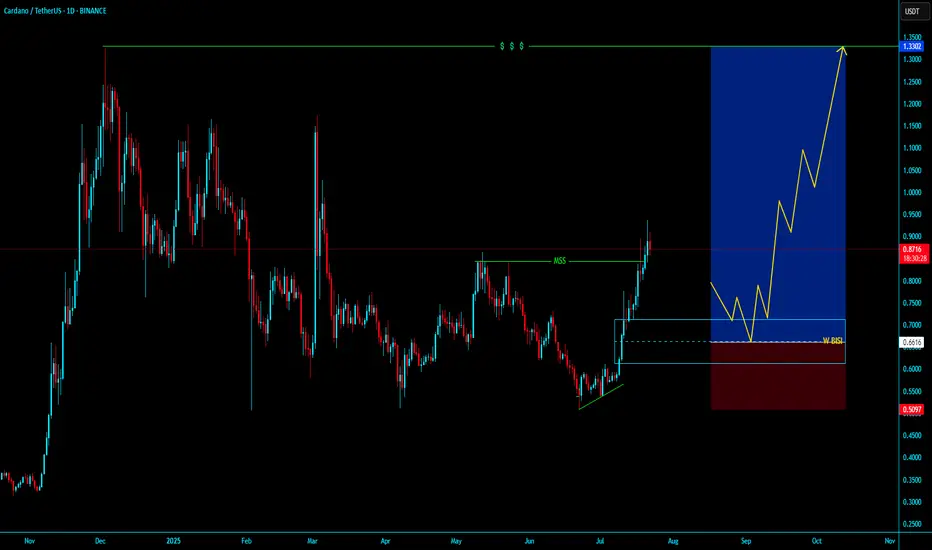
ADAUSDT BUY LONG ADAUSDT BUY LONG Weekly BISI
BullRun will starts it will going to moon for 4-5 month in daily tf .
Valid Mss with ValidOBI our buying zone .54 $ - .72 $ target atleast 7 - 10 $
holding for 3-5 month from buying , deeply buying from this weekly bisi , IF Market will more
correction then more opportunity to buy in deep , patiently wait for Enjoyable Returns
Just Hold & Enjoyyyyyyyyyyyyyyyyyyyy
~ KGB Priyabrta Behera ~
ICT Trader & Advance Mapping SMC Trader
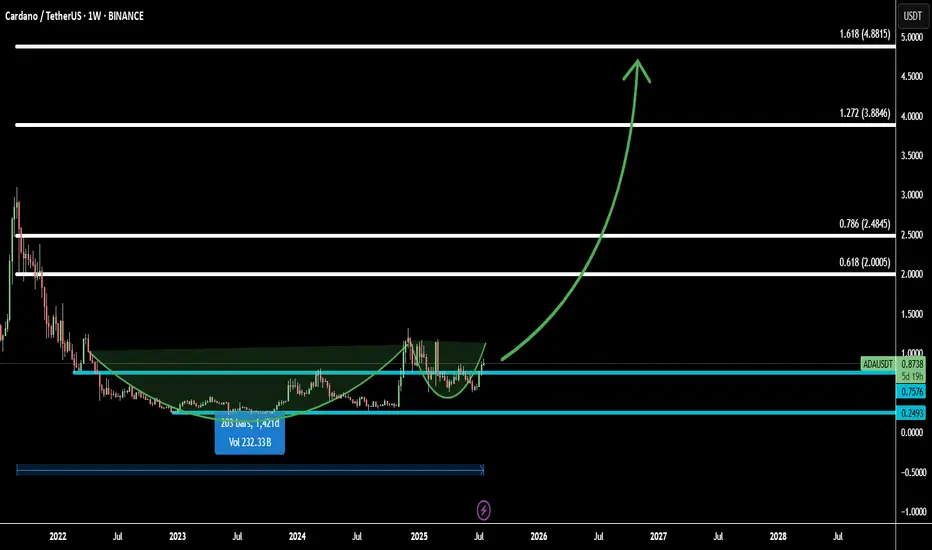
ADA Ready to Fly: Cup & Handle Pattern + Fibonacci TargetsCardano (ADAUSD) is forming a classic cup and handle pattern on the higher timeframe, signaling a bullish continuation setup that often precedes strong upward moves.
Combined with Fibonacci extensions, the breakout potential is high, with multiple target levels mapped out:
Target 1: 0.618 Fib – 2.0005 - confirms breakout strength
Target 2: 0.786 Fib – 2.4845 - momentum continuation zone
Target 3: 1.272 Fib – 3.8846 - full extension based on pattern measurement
Target 4: 1.618 Fib – 4.8815 - aggressive bull target for long-term holders
If ADA breaks the handle with strong volume, it could initiate a powerful rally. This setup is ideal for swing traders looking for a high-probability entry.
Let’s catch the next big move together! 🚀
Cardano Update · Straight Up · New ATH & MoreCardano is easy to predict. We already have three great examples. Remember Bitcoin Cash? It has been growing straight up for 100+ days. Cardano will do the same. What about XRP? It is already trading at new all-time highs and Cardano is in the same group/category; big market capitalization. Then we have Ethereum which is the most recent example, as predicted, it is moving straight up. No retrace nor correction which is normal because it went sideways for months before the current bullish breakout.
Cardano has now four green weeks and this is the fifth one. This one will not be red which means straight up.
Technical analysis
I already told you about EMA55 and EMA89, weekly timeframe, ADA is trading above. MA200 as well. Notice the descending triangle on this chart. This was the consolidation period and it already broke bullish.
Targets & new all-time high
Expect ADA to continue growing until it hits the highest prices since 2021. $1.83 and beyond. Once this level is conquered, we can start rooting for a new all-time and this will happen with a high level of certainty.
Cardano will easily reach $3 and move beyond $4. I think it can go much higher...
I will do a new publication with updated new all-time high projections. The targets above are valid for the coming months.
Just a friendly update.
And thank you for your continued support.
(If you enjoyed this post, follow!)
Namaste.

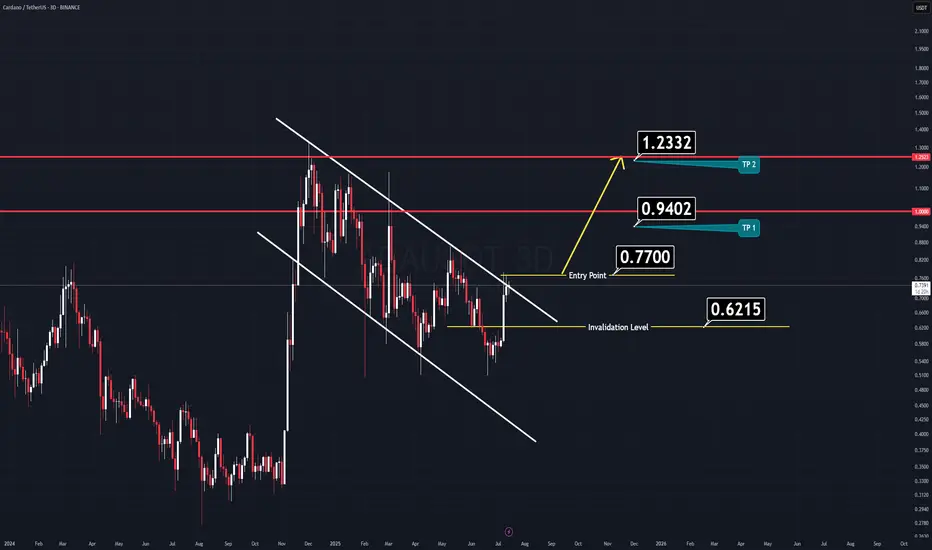
ADA Analysis (3D)Here’s another clean and straightforward chart, this time on Cardano (ADA).
ADA has formed a large flag pattern, which looks poised for a breakout soon.
Just like the previous setup, nothing complicated here.
✅ Entry Idea:
Consider entering when the price breaks above the previous daily candle’s high.
All the key levels are already marked on the chart for easy reference.
Keep it simple,
Good Luck.
HolderStat┆ADAUSD broke through the resistanceBINANCE:ADAUSDT is trading just below $0.406 after bouncing from $0.386. The setup favors a breakout if resistance is breached. Price structure remains bullish while above $0.386.

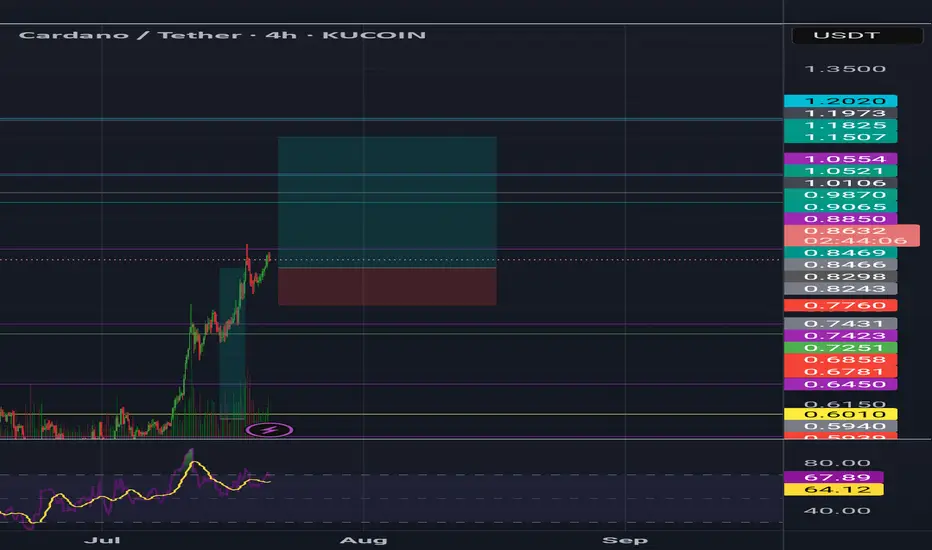
ADA Spot Entry – Pullback Opportunity AheadADA has reached a major resistance zone, and with the broader market appearing overbought, a healthy pullback looks likely. We’re watching for a dip into the next key support area to accumulate for spot holdings.
📌 Trade Setup:
• Entry Zone: $0.75 – $0.77
• Take Profit Targets:
o 🥇 $1.00 – $1.15
o 🥈 $1.50 – $1.60
• Stop Loss: Just below $0.72
ADA potential breakoutADA is near a breakout point on the daily timeframe. If we break out the triangle I have 2 targets.
Target 1: $1.135
Target 2: $1.325
Best of luck to all.

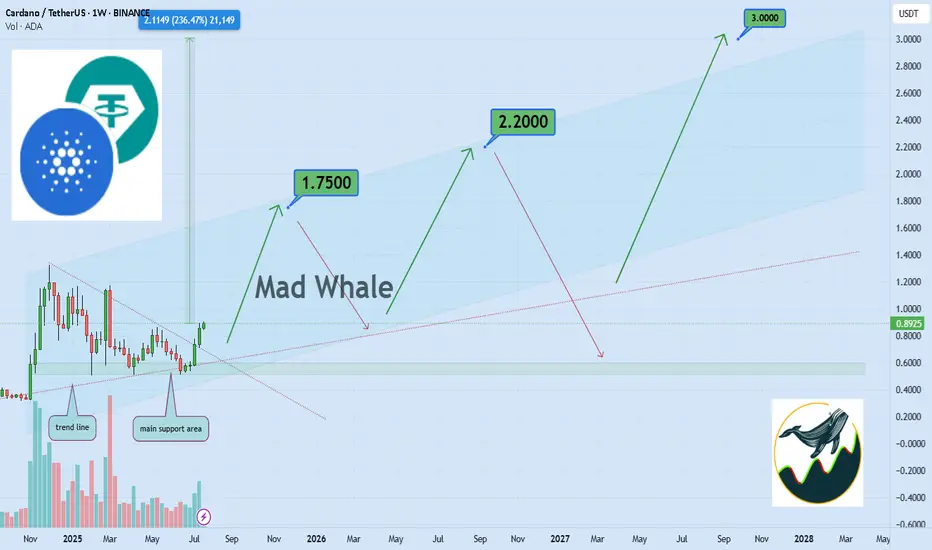
Bullish Cardano Setup: $1.75, $2.20, $3 Price TargetsHello✌
Let’s analyze Cardano’s upcoming price potential 📈.
BINANCE:ADAUSDT , I expect a long-term upward bullish trend.
There are three main targets in this analysis: $1.75, $2.20, and a final target of $3. These targets could be reached within 2 to 6 years.
The current bullish channel may stay valid and continue moving upward.
✨We put love into every post!
Your support inspires us 💛 Drop a comment we’d love to hear from you! Thanks , Mad Whale🐋
🐋Many of the points and levels shown on the chart are based on personal experience, feeling, and over 7 years of research and daily study of crypto charts.
Some of the lines, channels, and price zones are drawn to make the chart easier to understand and to help imagine possible future price movements.
I’ve also included one very big drop in price even bigger than the others because in the crypto market, it’s common for prices to suddenly fall hard and push out small investors and traders with positions.
The targets on the chart are not guaranteed; they might be reached, or they might not.📚
📜Please make sure to do your own research before investing, and review the disclaimer provided at the end of each post.
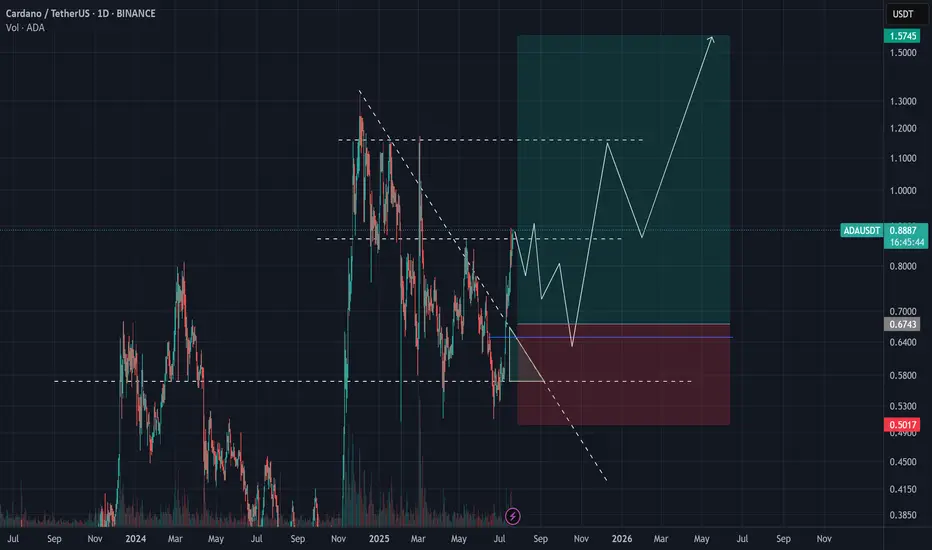
Bull Flag Confirmed on ADA — Next Stop: $3!Cardano Breakout: Is the Downtrend Finally Over?
Cardano (ADA) has finally broken out of its long falling channel after months of sideways and downward movement. The current price is around $0.88 after a strong rally from the $0.45 zone.
Here’s what the chart shows:
ADA broke above the trendline that had been holding it down since late 2023.
Strong price momentum and a shift in structure suggest bulls are in control.
A large demand zone sits between $0.58 and $0.75, which now acts as support.
If the price stays above $0.78–$0.80, there’s a good chance for more upside.
What to expect next:
Price may pull back slightly to retest the breakout zone.
If that level holds, the next major targets are around $1.10 and $1.35.
If Bitcoin remains stable or altcoins gain strength, ADA could push even higher in the coming weeks.
Key Levels:
Support – $0.75, $0.68
Breakout Level – $0.80
Resistance – $1.10, $1.35
Overall, this breakout is an important shift. If the retest is successful, ADA might finally enter a new uptrend.
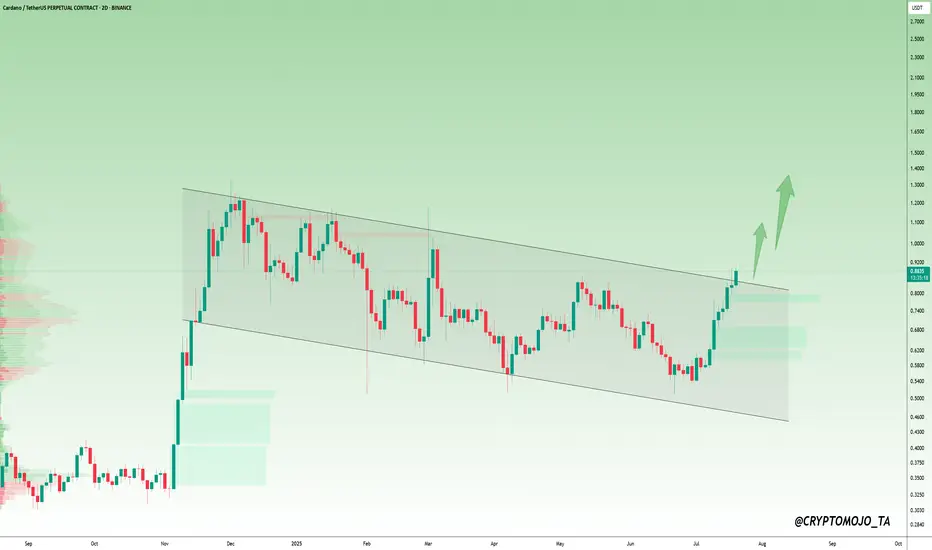
Cardano (ADA) Analysis – July 20, 2025The breakout above the $0.80 level was a major technical milestone for Cardano.
✅ The price not only breached the resistance, but also confirmed it with a strong daily close — clearly signaling that sellers have lost control of the market.
Now, we’re likely to see buyers step in and take over the trend.
🕒 For a more optimal and lower-risk entry, I suggest watching the $0.64 area.
There’s a strong possibility that liquidity around this zone could push the price aggressively toward $2.20, backed by solid bullish momentum.
🎯 This setup offers a promising upside — stay alert for confirmation signals.
ADA / USDT lying on support ,ready to bounce and break trendlineADA/USDT broke above horizontal resistance and is now retesting from the trendline above. If it holds this support and bounces, a strong move toward $1.00, $1.20, and even $1.40 could follow. One to watch closely in the coming days.
