Abu Dhabi Ports at a Technical Crossroads: Breakout or Breakdown📈 Abu Dhabi Ports – Daily Technical Analysis
🗓️ Date: July 23, 2025
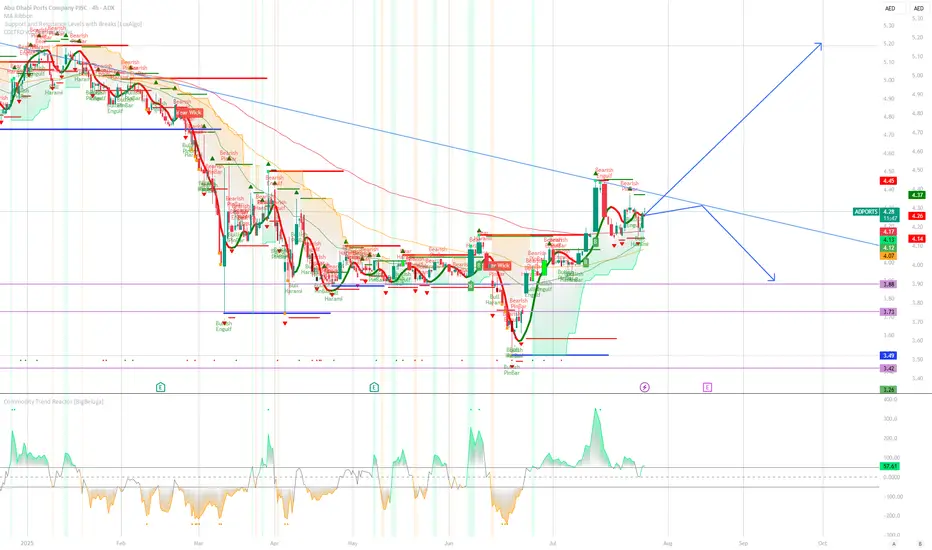
📍 ADX: ADPORTS | Price: AED 4.26
➤ Trend Structure:
Abu Dhabi Ports is still trading below a long-term **descending trendline**, keeping the broader bias cautious. Despite a recent bounce from the AED 3.49 lows, price has hit dynamic resistance near AED 4.45 and is showing hesitation.
➤ Candlestick Signals:
* Recent candles show Bearish Engulfing and Harami formations near resistance, indicating potential exhaustion of the bullish move.
* Previous reversal was preceded by a strong Bullish Engulfing near the base support (AED 3.42–3.49).
➤ Scenario Outlook:
🔵 Bullish Scenario (Breakout):
A confirmed breakout above the descending trendline (\~AED 4.45) with strong volume could trigger a trend reversal, opening the path to AED 5.00+ targets. Momentum indicators must turn sharply positive to confirm strength.
🔴 Bearish Scenario (Rejection):
* A rejection from current levels could lead to a pullback toward **AED 4.10**, and possibly retest **support zones** at AED 3.88, 3.73, or the prior swing low at **AED 3.49**.
* Breakdown below AED 4.07 would confirm short-term bearish pressure.
ADX:ADPORTS
📊 Momentum & Indicator Readings:
* **Commodity Trend Reactor** shows weakening bullish momentum, currently around neutral (41.44).
* Price is consolidating inside the Ichimoku cloud; bias remains undecided until breakout.
🧭 Conclusion:
Price is at a **critical inflection zone**.
* Wait for breakout above AED 4.45 (with strong follow-through) for long positions.
* A failure here may confirm a lower-high and favor downside continuation.
📌 Strategy:
"Plan for both outcomes — react to confirmation, not prediction."
ADPORTS trade ideas
ADPORTS has the potential to change trendADX:ADPORTS getting ready for a leg up and has the potential to change trend. Long to target levels shown on the chart, stop daily close below 5.03 AED.
P.S. Not financial advice, my view only!

RejectionClearly we can see a rejection candle right at the resistance line, meaning still buyers are not ready to take the price any higher. It can come down to retest the support area most likely from here. Or once the resistance is broken we can see some good momentum to the upside. For now its in a NO trading zone.
Hit like & follow guys ;)

Billateral Pattern Identifiedits forming a pattern of
Assending triangle
also
Rising Wedge
Which indicates the movement can happen both ways
If it drops below 5.90 then it will be a confirmation of a bearish reversal
If it goes above 6.50 then it will be continuation of the bullish move
Make entries after 6.50 to ride the bull trend

Not Interesting For now its back in no trading zone, last candle indicates selling pressure and we dont buy when big boys are selling. Let it come to support zone and do its magic. For now stay out of it !!!
Hit like & follow ;)
