INSIGHT: ADX Index Positioned for Breakout—But Eyes on ResistancThe FTSE ADX General Index is at a technically sensitive level, hovering near the R1 (Classic) resistance of 10,148 and marginally above key moving averages (VWMA 20 at 10,056.94 and HMA 9 at 10,266.15). This suggests **bullish momentum is building**, supported by a “**Strong Buy**” signal on techni
Related indices
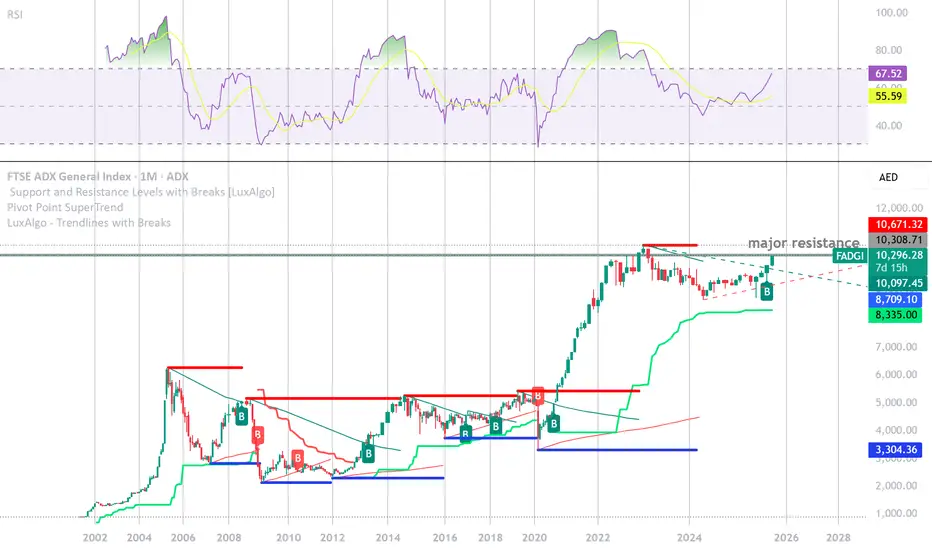
ADX ready for take off?📈 Current Price & Volume
• The index closed most recently around 9,981.5 AED—near its 52‑week high of 10,000.87 AED
• Today’s trading volume was unusually strong—roughly triple the 3‑month average—which often signals a potential trend shift ().
⸻
🔍 Technical Summary (Investing.com)
• Overall stan

FADGI Index: Sideways Movement After Downfall
Title:
FADGI Index: Sideways Movement After Downfall
Greetings, Fellow Traders!
🌟 Hello everyone,
The FADGI Index is currently experiencing a phase of sideways movement following a recent downfall, signaling a potential shift in market dynamics.
ADX:FADGI
Key Observations:
- The FA


Abu Dhabi MarketAbu Dhabi Market broke the neckline in the negative slanting head and shoulders pattern...then confirmed it by breaking the neckline of the negative Adam and Eve pattern.
The lower targets are activated, but usually, and from my experience, prices do not go directly to them.. In 80-90% of cases, th

Make Or Brake!Abu Dhabi Securities Exchange is at crucial support area, it have broken the trend line which is a sign of weakness but still the up trend is intact. We need more bulls to get activated at current levels to push the market index higher.
Scenario One
Either market can retrace 50% of Fib level

Bull Trend ADXAfter a long Bear trend from Nov 22 , Finally ADX has broken the bear trend and has started its Bullish movement.
Its a great time to take entries

Under PressureSurprisingly ADX stocks are not performing well for the last 2 months or so. Market can come down to retest the support level again that is around 9800. Burjeel will also be added to the index, its getting listed tomorrow so expect so high volumes. All the best to Burjeel Holdings.
Hit like and fol

Ready to go higher!!Over all market index is looking very promising and more upside is expected. Bulls are in the house!!!
!
Hit like & follow guys ;)

See all ideas
Summarizing what the indicators are suggesting.
Oscillators
Neutral
SellBuy
Strong sellStrong buy
Strong sellSellNeutralBuyStrong buy
Oscillators
Neutral
SellBuy
Strong sellStrong buy
Strong sellSellNeutralBuyStrong buy
Summary
Neutral
SellBuy
Strong sellStrong buy
Strong sellSellNeutralBuyStrong buy
Summary
Neutral
SellBuy
Strong sellStrong buy
Strong sellSellNeutralBuyStrong buy
Summary
Neutral
SellBuy
Strong sellStrong buy
Strong sellSellNeutralBuyStrong buy
Moving Averages
Neutral
SellBuy
Strong sellStrong buy
Strong sellSellNeutralBuyStrong buy
Moving Averages
Neutral
SellBuy
Strong sellStrong buy
Strong sellSellNeutralBuyStrong buy
Displays a symbol's price movements over previous years to identify recurring trends.