Lulu Holdings: Chasing the Gap – Key Levels in Focus 🔍 Summary: Key Points to Watch for Lulu Holdings
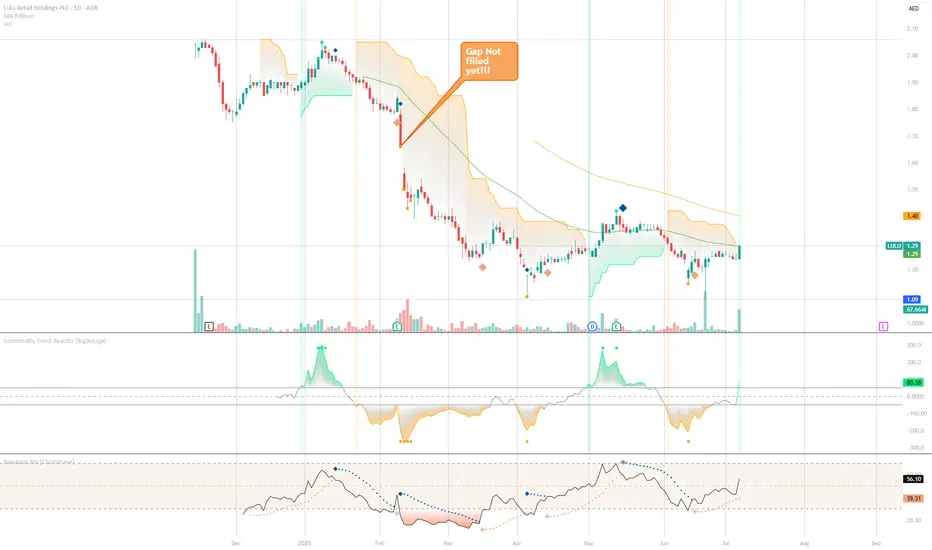
📉 Gap Down: A notable gap down between 1.66 AED and 1.56 AED occurred between February 11–12, following a negative earnings catalyst. This gap now serves as a significant technical barrier.
📊 Recent Volume Spikes: There has been a clear increase in trading volume since the gap, indicating strong market activity. This volume surge is critical and may reflect either institutional interest or volatility-driven participation.
🟠Resistance Zone: The 1.56–1.66 AED range is the primary resistance:
🔻 If price approaches this zone with falling or weak volume, it could face rejection and pull back.
🔺 A clean breakout above 1.66 AED with strong volume would suggest serious buying interest and a potential gap fill continuation.
🟢 Support Zone: Immediate support is located at **1.30–1.32 AED**:
Holding this area signals stability and potential consolidation.
🔻 A breakdown below 1.30 AED could push the stock toward deeper support near 1.20 AED.
⏳ Gap Fill Potential: If price pushes back toward 1.66 AED on rising volume, this could initiate a full gap fill attempt , which would be a bullish structural signal.
📈 Volume Sensitivity:
Rising volume on upward moves** is essential to confirm bullish strength.
Declining volume near resistance** would indicate weak buying pressure and possible
failure.
🔍 Price Structure to Watch:
Formation of higher lows above 1.32 AED would indicate accumulating bullish momentum.
A failure to hold above this zone would signal potential continuation of the downtrend.
🎯 Bottom Line:
The 1.66–1.56 AED gap is the critical technical zone. Spectators should closely monitor whether the price can approach and potentially close this gap with strong volume or whether it will face resistance and reject. Volume will be the deciding factor in determining whether Lulu Holdings is stabilizing for a recovery or remains vulnerable to further declines.
LULU trade ideas
LULU Another Bullish Divergence but this time, it is different!!Good Day Trader!
LULU again showed a bullish divergence. What is different this tie? We have huge volume. which is a positive sign and soon we may see the Stock price rise after some consolidation. To have less risk we may plan to enter after the break out of the last Higher High as shown in the chart. Or we can take some positions in the consolidation for higher risk to reward ratio.
Thank you for following the channel, will to posting more charts.
Happy Trading!
Big Disappointment LULU is one of the stock in Abu Dhabi Securities Exchange that has disappointed many investors and traders. Right from the successful IPO everyone had a high hope for good returns from this stock and it did exactly the opposite. After the listing it could not take off we are seeing selling pressure almost everyday, Red candles are printed all over the chart. I was watching 1.28 zone very closely for a bounce but still no buyers are interested at current levels. My next area of interest is between 1.17-2.00 if we can see some buying pressure with good volumes i would take small position and wait for more price action to add more quantities. Overall of course its in a down trend.
Hit the like button and show your support guys ;)

LULU (ADX) The correction’s cooked!!🔥 LULU (ADX) – 1H Timeframe
Lulu Retail Holdings PLC
“LULU just cracked structure at 1.34 and flipped the script. The correction’s cooked, momentum’s shifting, and the bulls are looking to ride this wave straight into those stacked supply zones. Stops are tight, upside’s clean — this is where the move begins.”
🧠 Elliott Wave Breakdown
🔁 Wave (1) and (2) appear locked in
✅ Break of Structure (BOS) above 1.34 confirms bullish reversal
🔼 Price now riding Wave (3) with pullback forming Wave (4) setup
🔺 Final target projected in Wave (5) zone at 1.79 – 1.84
🎯 Trade Setup
Entry 1.35 (current zone)
Stop Loss (tight)** Below trendline @ ~1.31 (for conservative traders)
Stop Loss (wide)** 1.25 (below demand zone for higher tolerance)
Take Profit 1.79 – 1.84
R/R Ratio ~1:3.2 – 1:4.5
“All structure, no noise. When price breaks out and retests clean, you either trust the wave or stay flat. That demand zone held — now let the market do its job.”
⚠️ Disclaimer
This analysis is for educational purposes only. Not financial advice. Use stop-loss strategies that fit your risk profile.

ADX LULU | Bullish Divergence | Possible Reversal | Trade PlanGood Day Trader!
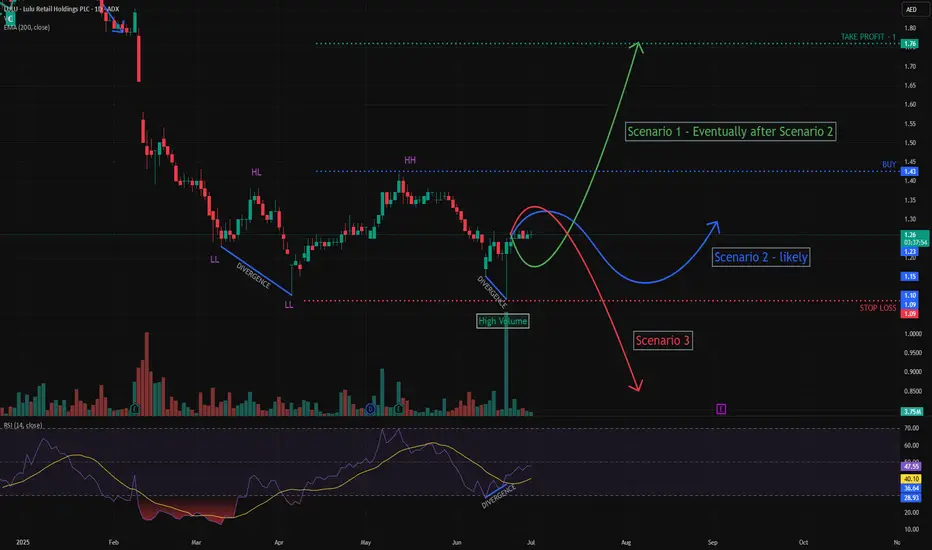
We observe a Bullish Divergence between the last two Lower Lows. There are three scenarios:
Scenario 1: The bullish divergence will take effect and the price will rise.
Scenario 2: The price can go sideways for consolidation.
Scenario 3: The price may ignore the bullish divergence and continue to drop forming new HL and LL.
We will take positions at the breakout. Accordingly refer to the suggested trade plan.
TRADE PLAN
Buy : 1.39
Stop Loss: 1.09
Take Profit: 1.69
Risk/Reward Ratio: 1.0
Follow me for more analysis!
Happy Trading!
