ADXBTC trade ideas
ADX 1H Timeframe Chart 14 December 2017ADX, sick retracement for this one. It might have found the bottom for now.
TA: it's going for a triangle pretty soon. MACD a bit positive, EMA's getting close and these get closer within the next few days. As the altcoins are doing pretty well, I'm expecting ADX to break the EMA and cross it, which indicates a nice jump, as it didn't have any in the last few days. If not, we might check the support around 6000 Sats back again.


ADX looking bullishI am personally getting into ADX while it is near this bottom support line. ADX has bottomed out and has reached an all time low recently, crossing back over that all time low and holding it as support this morning. The 1D Stochastic RSI just crossed over indicating long term bullish movement and I believe that ADX can hit near the long term resistance line. I am setting my personal goal within 12-13k sats for almost a nearly 2x return and setting a tight stop loss 5% below the support line around 7,300 sats.

ADEX Pump - Short-Term TradeADEX on the 30 minute timeframe looks to be breaking previous resistance bullish with the high volume + break of previous resistance.
Just bought in at 8300.
Looking to exit a portion at 8800/9300 levels.
DISCLAIMER:
I'm simply sharing my trades so follow along at your own risk


ADX beta Release on 30 JanuaryI drew an optimistic chart to ADX. The interest about the innovative project that may compete with Google Ad-sense, may skyrocket the coin. Lets follow this coin for 30 days.

ADX/BTC BTRXDaily RSI seems to do a reversal.
Chart is forming a pennant formation.
A new market cycle may start.


$ADX Buy SignalI believe this is the same type of CUP and Handle Pattern I saw work out on $ADA about a week ago just before it had its massive break out. Over the next 4 days as the handle forms start to accumulate $ADX ...... Let me know what you think.

ADX - RISING WEDGE PATTERN / DECREASE AHEAD?!ADX has recently seen an increase along with all of the altcoins, the price has now formed a rising wedge pattern which is indicated an upcoming bearish trend, we can expect this currency to correct to the secondary support line is the wedge is broken downwards, it would then be a good time to accumulate theirs.
MACD confirms a bearish trend.
RSI has a lot of space for downwards movement.
Orange - Resistance.
Pink - Support.

AdEx(ADX) Trade UpdateI suggested to buy ADX @ 0.000108
Now it is at 0.000122
Target is 0.00016 | There is still room to buy!

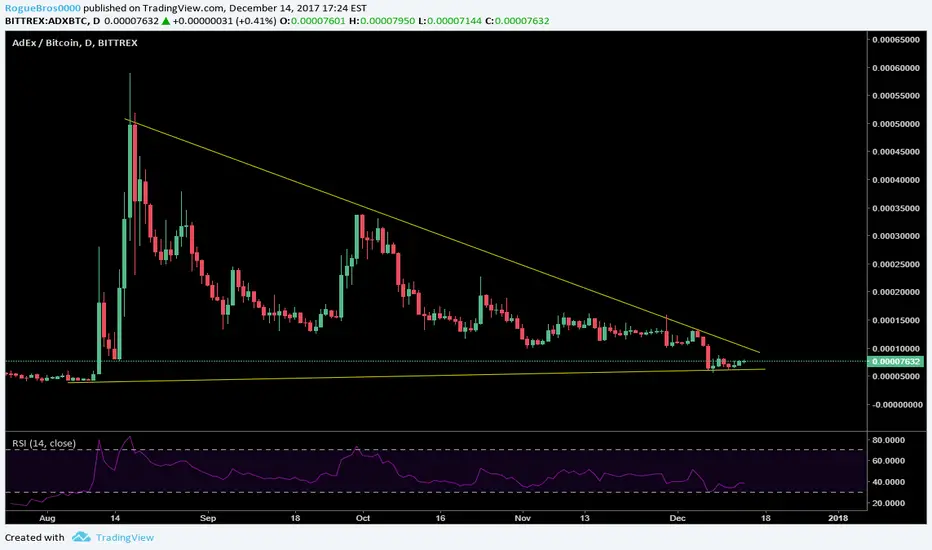
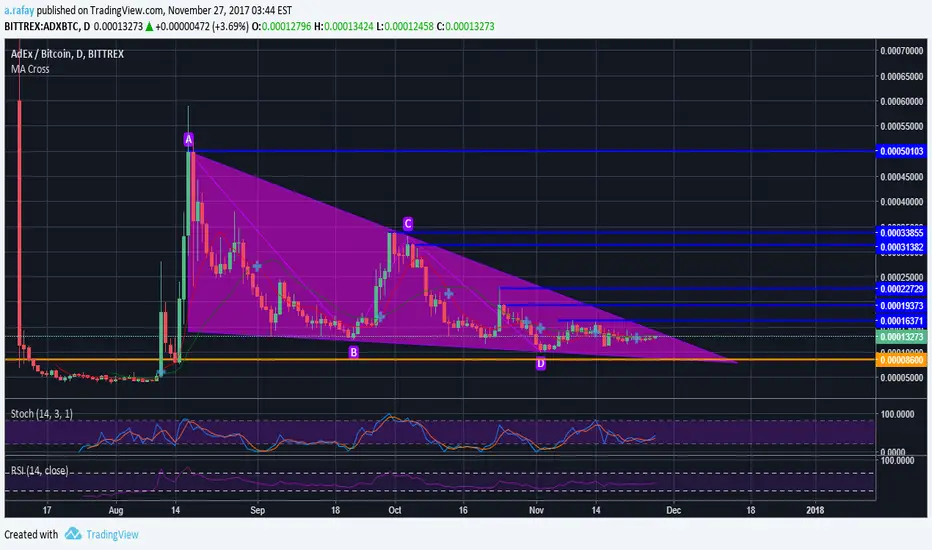
ADX BTC - Time for some action?ADX BTC on daily chart is now nearing the apex of a possible falling wedge. There are two possible scenarios:
1) The pair breaks out of the wedge above 0.000145. Conservative buy orders can be placed after the breakout confirmation. Targets are marked on the chart with blue lines. A break inside the wedge again on closing basis can be treated as stoploss
2) The price hits the top end of the falling wedge and falls back towards the lower end, in that case, buying range would be around 0.000086 (marked in orange). Targets will remain the same.
Happy trading :)
ADEX Analysis on Daily ChartADEX has been dropping fast from 30k to where it is now. However, the coin is showing some strength at the key support level where it has already bounced twice.
It should test the resistance level on the daily which I believe it will break.
If ADEX can break the key resistance at 20k and hold a daily candle above it, then there is very little resistance going up to 30k.
The Squeeze Momentum Indicator also shows that the price has been squeezing a lot. This means that it will have a lot of momentum behind the next move (whether it be upwards or downwards).
Personally, I've already entered a position because of this equilibrium pattern break on this 4 Hour Timeframe.
I think now is a good time to buy in or wait until key resistance break for free ride to 30k.
ALSO, in an effort to stay transparent - I bought in at 12330 satoshis. Will keep you all posted on my sale price(s).
DISCLAIMER:
I'm just sharing my trades so you can follow me if you want. Best of luck out there everybody! :)
PS: Just saw that I typed 'likely to REST resistance' when I meant to type 'likely to TEST resistance' sorry about that typo!

#cryptocurrency $ADX.X Relatively strong, building valueAdEx has been relatively strong against high Bitcoin volatility over the past few weeks, with a steady increase in value (ADXUSD, blue line) over this period. Recent fundamentals are positive and the coin's ripe for further positive catalysts. Risk/reward decent at these levels. Only thing hanging overhead is potential global crypto market effects from Bitcoin volatility, but when is that not the case?


#ADX ADeX rebound soon Adex #ADX should rebound soon. Currently under 11k sats, looking for 13k+ in near future.
Will bounce off support and go up a bit. Possible big breakout, but not likely in NEAR future. Look for a steady climb.

ADXBTC upside if BTC behaves?ADX is forming a huge pennant againt BTC on the 15min chart.
Lets see what it does.

ADX long term hodlsome big whales spoted something here... i'll join the ride! usally this oddly volume spikes are eithe fake pump and dump or legit buys... as it has some nice roadmap, i'll hold some for january.


