ADXBTC trade ideas

$ADX Breaking from descending trendline with increasing volume..$ADX Breaking from descending trendline with increasing volume...
Consolidating at resistance with many attempts to break above
As always wait for flip over resistance // Volume for confirmation
UCTS was flashing a buy signal a few hours ago...
#ADX
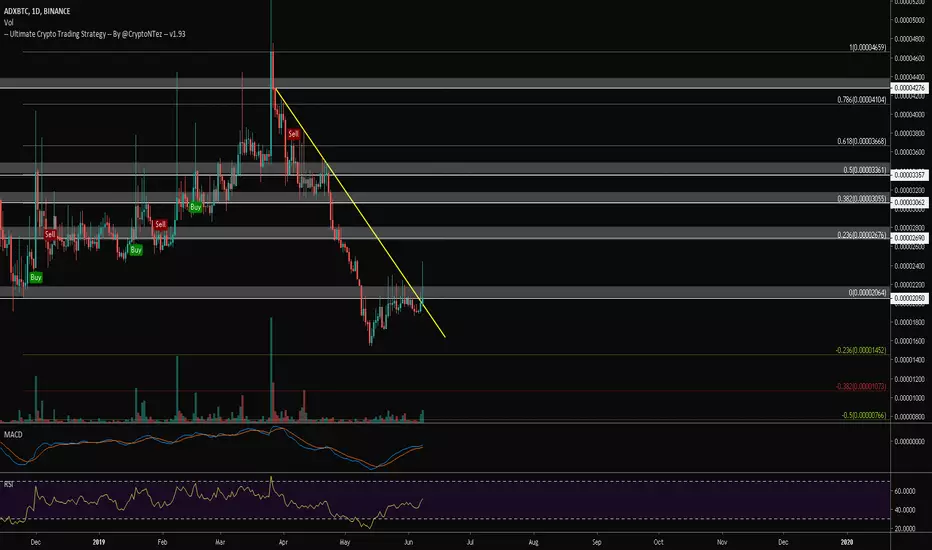
ADX gaining volume!ADXBTC is at bottom and has been accumulating, the volume has been increasing steadily, MACD & RSI looking bullish.
There is plenty of room for profits upto its ATH at low risk.
Just a waiting game for this one to go up.


#ADX Big OpportunityBuy Between - 0.00002000/0.00001700 Target in charts Stop After close 1d candle under 0.00001500 .


[ADXBTC](76%) AdEx Trade Signal @alanmastersWe have AdEx (ADXBTC) trading above EMA10. It is starting to look better by the minute.
We have similar signals as the other Binance altcoins that are moving right now.
AdEx can be next.
---------------
Trade: AdEx (ADXBTC)
BUY: 0.00002000 - 0.00002200
TARGET:
(1) 0.00002490
(2) 0.00002760
(3) 0.00003100
(4) 0.00003470
(5) 0.00003700
PROFITS POTENTIAL: 76%
(Buy-in calculated at 0.00002100)
STOP: Close weekly below 0.00001700.
---------------
Thanks a lot for the support.
This is not financial advice.
Namaste.

#ADX/BTC BULLISH REVERSAL ANLYSIS#MyBullishAnalysis #PriceAnalysis
#ADX is Looking Pretty Good now for Scalping.
#BB is squeezing in 2-6hr TF
Ema is making Cup Handle.
RSI IS OVERSOLD AND START GETTING VOL.
ALREADY CREATED 2 DOUBLE BOTTOMS
#### TARGETS SHOULD BE 5-10% (1995-2045)
#GOODLUCK

$ADX, pushing against resistance at last known ATL BTC level$ADX Very similar to other alts, pushing against resistance at last known ATL BTC level
A little overcrowded with resistances, I would wait a break over 2400sats to think getting a position...
For now volume seems low & descending trendline didnt break
Set alerts and wait
#ADX

ADX is bullish in short-term, time to grab some.BINANCE:ADXBTC
ADX runs in a parallel channel, heads to first Fibonacci resistance at around 2100 satoshi. A minor pull back is expected before another bull run takes place.
Buy zone and targets are as shown on chart. ADX should hold parallel channel to keep uptrend, the stop level should be place below 1860 satoshi.


ADX - Perfect for mid termIt's really good but it also can make another bottom. If it did wait for the next entry.
Buy now
Targets
3000
4100
5600
8000
Stop loss 1550
Time analysis: 2 Aug

ADX a real king?ADX already hit the first smal box target way over that!
the box target is usable again, and i added a few new targets..
trade safe.
Mr Stone Capone..

BINANCE:ADXBTCBuy: 2654 - 2690,
Best Buy: 2607 - 2548,
Sell:
Target 1: 2792 - 2823,
Target 2: 2869 - 2928,
Target 3: 3002
Target 4: 3103


ADX/BTCThe TCCS strategy forecast indicates a setup on the following pairing;
Coin : ADX/BTC
Exchange: Binance
TCCS strategy would be to Buy :
Between 0.0000335 to 0.0000355
TCCS strategy would be to Sell at :
Target 1 : 0.0000378
Target 2 : 0.0000405
Target 3 : 0.0000445
Trader Comments on the forcasted setup:
ADX/BTC EMA 100 follow the trend line
MACD create a rising triangle
OBV Bullish
ADX bounce on the trendline
These forecasts are not monitored by TCCS after posting. As such you will need to do your own research, stop-loss, find exit positions and conduct your own risk management in regards to position size. Should you prefer to follow a portfolio approch in order to maximize benefits join the VIP . Extra filtered calls stop loss management, exit points & usage of USDT to maximize the portfolio value are used in the VIP .

ADXBTC entered in bullish potential reversal zoneThe ADX is moving up by making different harmonics showing strong uptrend.
Now the price action has again retraced between 0.618 to 0.786 fibonacci to form some other harmonic and entered in potential reversal zone to take bullish divergence insha Allah.
The targets are:
Buy between: 0.00004291 to 0.00003845
Sell between: 0.00004640 to 0.00005691
Enjoy profits, regards,
Atif Akbar (moon333)


ADX/BTC - Down channel broken, uptrend start, huge support levelBuy zone:
3900 - 4000
Sell targets:
4185 +5.96%
4348 +10.08%
4650 +17.72%
Stop Loss: 3778 -4.36%
Notes: Down channel broken, uptrend start + huge support levels.

ADX ADXBTC----BREAKOUT ALERT--- Squeeze + Momentum changeEntry = Below 4000
SL = 3780
T1 = 4200
T2 = 4500

#BINANCE #ADX/BTC PRICE ANALYSIS AND PREDICTIONADX/BTC Ema is so trong now and ready to go up already made a curve bollinger band is ready to open guys, rsi over sold
this is gonna huge, kdj is already make curve in 4hr TF,
Current price is 3900
my targets are 4059-4150-4300
