AERGO: Golden Pocket Hit – Crash Incoming?On April 3rd, AERGO hit a historic low of $0.04746—and just 13 days later, it's trading around $0.60, an astonishing +1500% surge in less than two weeks. The rapid rise begs the question: What are the bulls aiming for next, and how sustainable is this move?
Key Observations:
Explosive Rally:
A

AERGO/USDT Analysis – 2 Strong Buying Zones
For this futures pair, we are approaching zones where abnormal buyer aggression was previously recorded.
If we test the $0.23–$0.205 or $0.185–$0.153 zones and see a reaction from buyers, we could see a strong upward move, potentially reaching at least the $0.30 level.

AERGO Crashes 61% After Binance Futures Listing Aergo (AERGO) saw a dramatic price crash on April 16, falling by 61.32% within 24 hours to $0.1590, despite high trading activity. The sharp drop followed Binance’s launch of the AERGOUSDT Perpetual Futures Contract, which allows trading with up to 15x leverage. The contract went live at 11:00 UTC.


Aergo price analysis The #Aergo coin is “old” from 2019, and its capitalization is only 59 million, and that's after a few days of 200%+ pumping from Korean exchange users in a falling market.
🟡 At the current price, of course, it's not worth buying OKX:AERGOUSDT , but why not keep an eye on it.
🟢 If the price is k

LIMIT ORDER - #AERGO/USDTLIMIT ORDER - $AERGO/USDT
Direction: #Short 🔴
Entry Price: 0.12943
Stop Loss: 0.15096
Target 1: 0.11975
Target 2: 0.11007
Target 3: 0.10039
Target 4: 0.090713
Target 5: 0.081033
Waiting till hits Target 2, changing SL to entry price

AERGO is in a counter-trend rally. Hunting for liquidityA sudden bullish rally amid a one-day influx of huge volume.
Hunting for liquidity located in the double top zone. This situation in 99% of cases ends with a false breakout and reversal
Countertrend rally to the resistance zone on the background of a bearish cryptocurrency market
Scenario: false

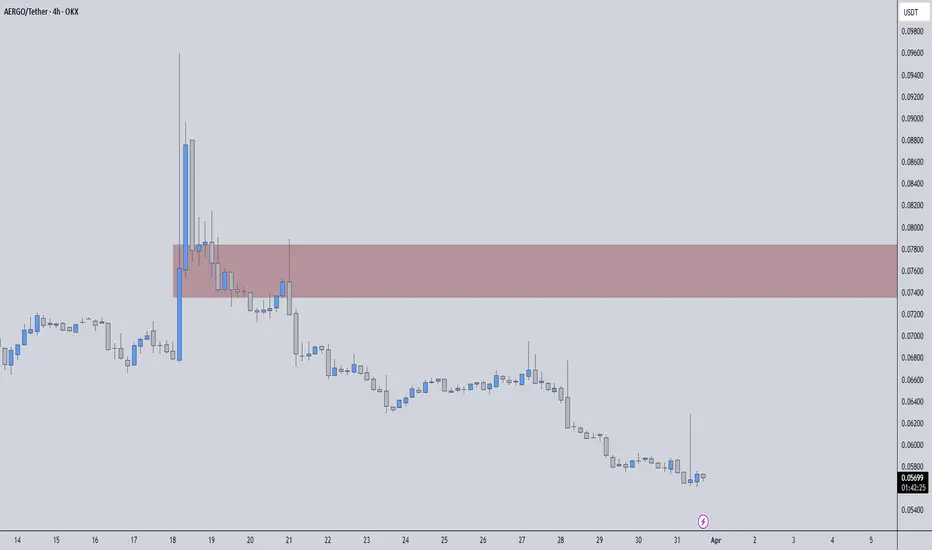
AERGOUSDT | Critical Resistance Zone AheadThe price is weak. Now, we are approaching the red box, a well-defined resistance zone where I will be watching closely for my usual short confirmations.
🔴 Key Observations:
✔️ Red Box = Strong Resistance – This level has historically been difficult to break, and I expect sellers to step in here.
✔
AERGO/USDTKey Level Zone : 0.1233 - 0.1240
HMT v4.1 detected. The setup looks promising, supported by a previous upward/downward trend with increasing volume and momentum, presenting an excellent reward-to-risk opportunity.
HMT (High Momentum Trending):
HMT is based on trend, momentum, volume, and market st

AERGOUSDT Analysis: Only the Best Trades, Believe MeListen, folks, sometimes a trade not taken is better than a losing one . Believe me, I know winners, and this blue box? It’s a fantastic demand zone , one of the best out there. Smart traders wait for the right moment—patience is key.
Here’s the Deal:
Smart Moves Only: Don’t be hasty, don’t

See all ideas
Summarizing what the indicators are suggesting.
Oscillators
Neutral
SellBuy
Strong sellStrong buy
Strong sellSellNeutralBuyStrong buy
Oscillators
Neutral
SellBuy
Strong sellStrong buy
Strong sellSellNeutralBuyStrong buy
Summary
Neutral
SellBuy
Strong sellStrong buy
Strong sellSellNeutralBuyStrong buy
Summary
Neutral
SellBuy
Strong sellStrong buy
Strong sellSellNeutralBuyStrong buy
Summary
Neutral
SellBuy
Strong sellStrong buy
Strong sellSellNeutralBuyStrong buy
Moving Averages
Neutral
SellBuy
Strong sellStrong buy
Strong sellSellNeutralBuyStrong buy
Moving Averages
Neutral
SellBuy
Strong sellStrong buy
Strong sellSellNeutralBuyStrong buy
Displays a symbol's price movements over previous years to identify recurring trends.