I want to short aeroI really want to short AERO but I have reason to believe it may still go up. I’m waiting on one more confirmation
AEROUSDT trade ideas
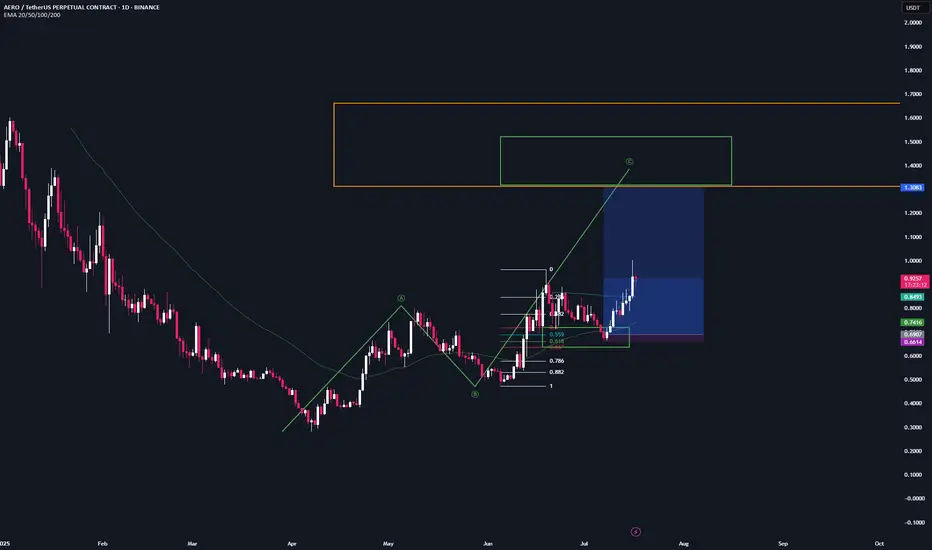
AERO/USDT parabolic moveAERO/USDT is setting up for a parabolic move, with price structure aligning perfectly with a major daily supply zone near the $1.33 level. After consolidating and holding above key support, the chart suggests strong upside momentum may be imminent.
Entry Zone: $0.69 – $0.75 (green box)
Take Profit Targets:
• TP1: $0.91
• TP2: $1.13
• TP3: $1.33 (final target & supply zone match)
🔻 Stop Loss: $0.67 (below last swing low)
This setup offers an attractive risk-to-reward ratio with clear structure and upside targets. Ideal for traders watching for explosive breakouts from accumulation phases.

AERO | Trade SetupA few days ago, we activated a new bullish structure on SPARKS:AERO on the daily chart.
I’m opening a long position at each key level, as there’s a high probability the market will react bullish from there,
The target region lies at $1.32

AERO | Trade-UpdateWe’re in full profit on our $AEROtrade.
I took 30% out at the last high, the next target is the bullish target zone (green)
Gave yall that one for free — 12 R/R so far lol.
Your win rate doesn’t need to be high — 30–40% with solid R/R is enough to be profitable.
Have a blessed day!
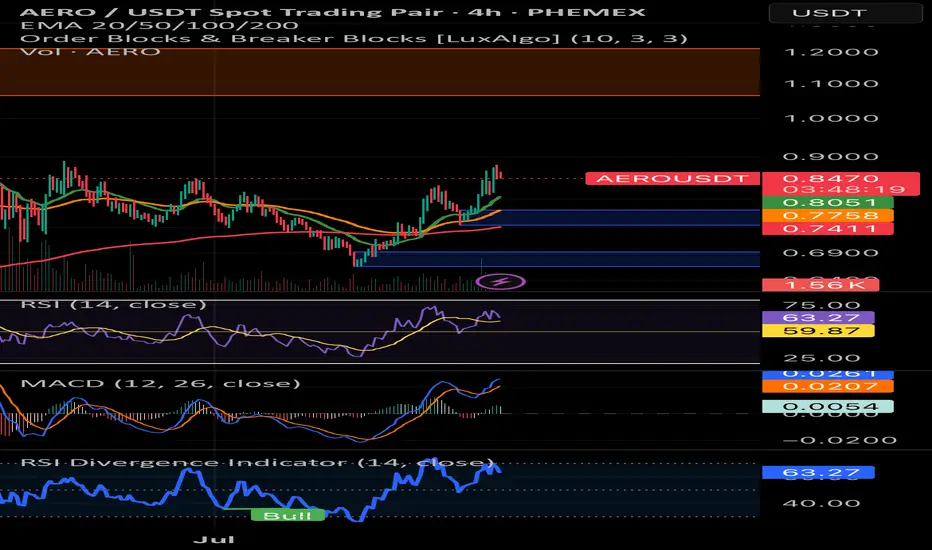
AERO | Potential Coinbase IntegrationCoinbase is integrating DEX trading into its main app. The integration will use the Base blockchain. For now, it's unclear which DEX they will use, but I think Aerodrome, as the biggest one, has a good chance.
Technically, AERO demonstrates strong bullish momentum with a clear pattern of higher lows since the June bottom around $0.30. The token has successfully broken above multiple resistance levels and is currently testing the critical $0.848 zone.
Key Technical Observations:
Bullish Structure: Clear ascending channel with consistent higher lows
Momentum: RSI showing healthy levels without being overbought
Risk Considerations:
Overall crypto market sentiment remains crucial
Integration news may already be priced in
The combination of technical strength and potential fundamental catalyst creates a compelling bullish setup for AERO in the near term.
Fallihg Wedge on AeroUSDT Reason to buy:
1. There's a falling wedge pattern in daily timeframe
2. Good volume
3. Stochastic oversold
4. Risk reward ok

AERO Long Swing Setup – Strong Pullback into Fibonacci SupportAERO has shown notable strength in recent months and is now retracing into a key support zone, aligning with the 38.2% Fibonacci level. The $0.75–$0.80 area offers a solid long swing opportunity.
📌 Trade Setup:
• Entry Zone: $0.75 – $0.80
• Take Profit Targets:
o 🥇 $1.04 – $1.32
o 🥈 $1.60 – $2.05
• Stop Loss: Daily close below $0.70

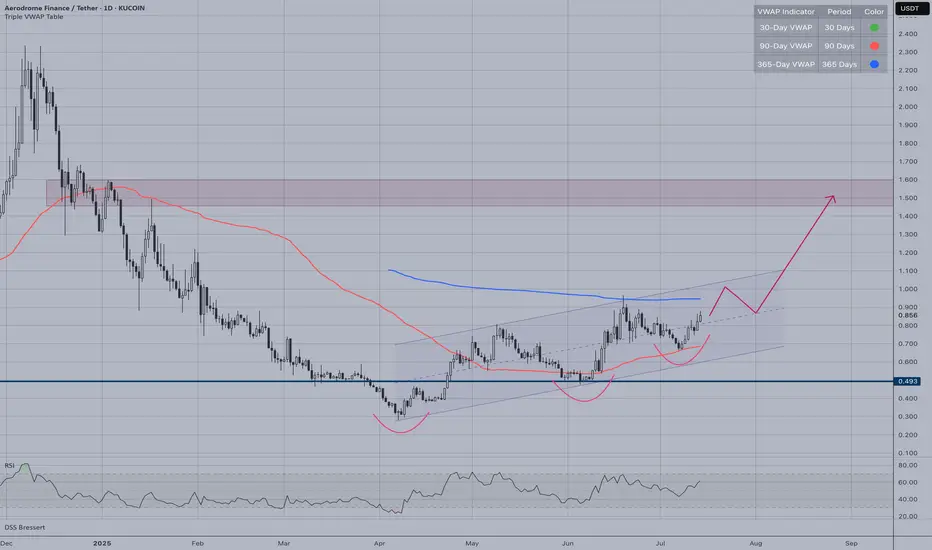
AERO | Waiting for a Higher LowThe setup favors patient entry on any pullback that forms a higher low, confirming the bullish momentum while minimizing downside risk.
Entry Strategy:
• Wait for higher low confirmation
• Validates uptrend continuation
• Better risk/reward positioning
Bullish Signals:
• RSI reset from oversold levels
• Clear accumulation base formed
• Breaking out of consolidation range
Risk Management:
• Stop below $0.493 support
• Invalidation if price fails to hold current levels
• Breakout above $0.80 accelerates move
• Target Zone: $1.50 resistance area

Bullish Tone, and made a trade based on Pivots amd FVG in comboTrade Analysis
(1) Trade Plan:
The idea was that the short term trend looked bullish, hence I marked up the key levels and checks to see if the price was at any of the pivot levels. Based on the idea when price crosses the Centre Top Pivot and is above a support . Further more it already visited a recent Bullish.. Hence the price may continue towards R1 above.
-
(2) Indicators (4 of 5):
- Only Pivot and Support lines and FVG
(3) Confirmations (3 of 3):
- 30 min candle closing well above the TOP Centre Pivot line.
(4) Risk Management Plan:
- This was little high as it was set to below the end of the Bullish FVG at the bottom. On hindsight i should have waited on my entry for a revisit. However sometimes i don't wait as it does not revisit.
(5) Profit Target:
- R1
(6) Stop Loss:
- Bottom Of FVG
(7) Entry:
- First Candle after 30 min candle closed above TCP
(8) Profit Taking Plan:
-
(9) Analyzation:
-
(10) Psychology of the Trade:
-
(11) Overall Rating:
(12) What was Good:
-
(13) What was Bad:
-
(14) Improvement Areas:
-
(15) Rule Broken & Key Takeaways:

UPDATE ON AERO SHORTS ,Perfect short area $0.95-0.98UPDATE ON AERO SHORTS
Perfect short area $0.95-0.98
Still targeting $0.77 or Down
Look like dumping time soon
Right now at $0.95
Not a Financial advice

UPDATE ON AERO SHORTS ,Anything above $0.8450 is a good short DETAIL UPDATE ON AERO SHORTS
Anything above $0.8450 is a good short
Targeting $0.77 or $0.76 Area
Not a Financial advice

AERO SELL SETUP , Sold From $0.79AERO SELL SETUP
Currently $0.79
Sold From $0.79
(Trading plan If AERO go up to $0.84
will add more shorts)
Expecting target $0.74 OR DOWN
In the event of an early exit,
this analysis will be updated.
Its not a Financial advice

SPKUSDT Long Opportunity | UT Bot Signal + Fib Extension PlaySPKUSDT showing a bullish setup after a UT Bot BUY signal at 0.0530–0.0535 zone.
Confirmation with:
📈 Volume breakout
✅ QQE MOD green spike
💹 EMA crossover
🎯 Targets:
TP1: 0.0560
TP2: 0.0578
TP3: 0.0600 (Fibonacci 1.618 extension)
🛡️ SL: 0.0518 (below swing low)
Risk-to-reward is favorable. As always, manage your risk.

Aerousdt trading opportunityAEROUSDT has completed a 5-wave decline into a Strong Demand Zone around $0.40, followed by a classic liquidity sweep below the swing low, this move suggesting potential exhaustion of the bearish momentum.
The subsequent recovery and structure shift have validated a bullish reversal, as price reclaims above the strong demand zone and now trading towards $0.718. Price currently forming potential bullish formation with base zone around the provided Buy Back zone towards $0.57, A break above this bullish formation could trigger a wave-based impulsive rally toward $0.916, then $1.635, and ultimately the External Supply Zone near $2.351–$2.372.
Failure to maintain the ascending trendline support or a breakdown back into the demand region would invalidate the bullish projection and call for reassessment of underlying demand strength.

AERODROME About to Defy Gravity? One Final Obstacle!Yello Paradisers — did you catch this developing setup in real-time on #AERO? After calling the completion of the higher-degree Elliott Wave 1 structure followed by an ABC correction, the chart is now flashing a high-probability opportunity — but only if a key resistance gets flipped in the coming sessions.
💎#AEROUSDT appears to have just wrapped up with point C printing a strong bounce from the R/S level, a zone that previously acted as a powerful base during the earlier markup phase.
💎The impulsive 5-wave structure clearly marked the first leg of strength, topping out perfectly in confluence with standard wave theory. What followed was a clean and controlled ABC correction.
💎Price action is currently pressing up against a well-defined resistance, which is not just horizontal but also perfectly aligned with the dynamic MTF EMAs — creating a confluence rejection zone. These moving averages have been compressing into the structure, adding weight to this level as a final barrier before a breakout scenario can unfold.
💎What we are now watching is simple: if we get a confirmed candle closing above the current resistance range, it would be a textbook continuation signal. That close would signal a probable structural shift — a break away from the corrective phase and the beginning of a new leg toward higher resistance levels around the 0.754 to 0.792 zone.
💎Until then, caution is critical. Any weakness or failure to close above resistance would imply the pair is not ready yet. Worse, a candle closing below the 0.446 invalidation level will confirm that the bulls are not yet in control and a deeper move is likely before a real reversal emerges.
💎This setup is not one to force — but it's certainly one to track closely. Everything is aligned for a breakout, but we do not front-run resistance in uncertain zones. That’s where most get chopped up. Confirmation is key, and when the market gives it, we act with full conviction.
This is exactly how Paradisers operate. We wait. We confirm. We execute only when all pieces align. No guessing, no emotional decisions — just disciplined, high-probability trading.
MyCryptoParadise
iFeel the success🌴

Aerodrome Finance: Your Altcoin ChoiceHere is a chart with perfect bottom price dynamics, Aerodrome Finance (AEROUSDT).
There is a falling wedge pattern and this pattern ends with a rounded bottom. The rounded bottom is a classic and strong reversal signal. See how back in 2024 this same pattern led to growth.
Here the rounded bottom is coupled with a new All-Time Low as well as rising volume. Both factors add further strength to this pattern as a reversal signal.
This is all I have to say to support a bullish wave.
The correction started in early December 2024. It went on for exactly four months. The duration of this correction is also quite revealing because corrections tend to last between 3-6 months. In a bull market, normally they last between 2-3 months. Since this one is preceding a bull market, it can last longer and that's what it did.
Now that all gains have been removed, a new All-Time Low. The market is ready and can grow really strong.
Whoever remains holding is really in it for the long-term. If you are not holding, this is a great buy. The price available now won't be around for too long. Just watch, once it starts growing and we look back, it will be easy to realize that the bottom buy opportunity lasted only a few days. That's it, a few days of great entry prices and then a long-term bullish wave.
The time to buy is now.
Thanks a lot for this Altcoin Choice.
Your support is highly appreciated.
Namaste.

Trading opportunity for AEROUSDTBased on technical factors there is a Buy position in :
📊 AEROUSDT
🔵 Buy Now
🪫Stop loss 0.4780
🔋Target 0.5870
📏 R/R 1,5
💸RISK : 1%
We hope it is profitable for you ❤️
Please support our activity with your likes👍 and comments📝

Trading opportunity for AEROUSDTBased on technical factors there is a Buy position in :
📊 AEROUSDT
🔵 Buy Now
🪫Stop loss 0.6800
🔋Target 1.1320
📏 R/R 2
💸RISK : 1%
We hope it is profitable for you ❤️
Please support our activity with your likes👍 and comments📝

Trading opportunity for AEROUSDTBased on technical factors there is a Buy position in :
📊 AEROUSDT
🔵 Buy Now
🪫Stop loss 1.4580
🔋Target 1.6500
📏 R/R 2
💸RISK : 1%
We hope it is profitable for you ❤️
Please support our activity with your likes👍 and comments📝

AERO in downward momentumAERO still moving down. sitting strong at support of 1.31$ and at Fib 78.6; has fallen below trend line on 12H. POC is $1.20; put bid in at 1.29 (under fib78.6) and at 1.20 POC and 1.17 if feeling lucky at bottom of FRVP. definitely going back to 2.35 and beyond by months end.

3 Altcoins Approaching The Lower Bound!Since you enjoyed my previous post about 3 Altcoins Rejecting the $5 mark!
Here's an interesting one about altcoins retesting the lower bound of the wedge pattern:
BINANCE:PYTHUSDT
PYTH has been in a correction phase and currently approaching the lower bound of its rising wedge pattern marked in blue. As long as the green structure holds, I will be looking for trend-following longs on lower timeframes.
KUCOIN:GLQUSDT
GLQ has been in a correction phase and currently approaching the lower bound of its rising wedge pattern marked in blue. As long as the green structure holds, I will be looking for trend-following longs on lower timeframes.
COINEX:AEROUSDT
AERO has been in a correction phase and currently approaching the lower bound of its rising wedge pattern marked in blue. As long as the green structure holds, I will be looking for trend-following longs on lower timeframes.
Which altcoins would you like me to cover next?
All Strategies Are Good; If Managed Properly!
~Rich

this way or that feat Aeroranging for quite a time can be frustrating for sure but no other option lets see

$AERO Bearish Signal -37% Potential DropBYBIT:AEROUSDT.P Chart
Daily time frame created and bearish divergence on the RSI and now starting to produce lower highs.
Head & Shoulders pattern forming, which would lead to a 37% drop to the Point of Control around $0.74.
There is good support around $1.00, if this is broken it will be a fast drop.
Always have proper risk management, NFA.
Happy Trading :)
