AEVO Main Trend DEX L2 Listing 212 X !) Decrease -98% 06 25Logarithm. Term 3 days.
Asset super hype in the past, listing with overly positive and aggressive marketing at 212X!
1️⃣Q1 2023 Private Seed $0.0185 / $1.85 million
2️⃣10 05 2023 Private Series A $0.13 / $6.01 million
3️⃣Q4 2023 Private Series A+ $0.25 / $8.75 million
4️⃣13 03 2024 Listing on the

AEVO/USDT — A Classic Altcoin Bottom Structure🧠 Context:
Another chart showing a typical altcoin structure near the bottom. Price has dropped over 98% from the all-time high. The concept of a "bottom" here is highly abstract — risk remains elevated, and liquidity is thin.
📉 Chart Highlights:
▪️ Price is still moving within a descending channel

AEVO double bottom 250%AEVO/USDT has seen a ~98% drop from its all-time high, now potentially forming a double bottom pattern in the current accumulation zone. This structure, combined with flattening volume and emerging bullish divergence, suggests a possible trend reversal in the making.
Buy Setup :Risk/Reward :9
Entr

What's coming up for AEVO?Aevo has to break $0.13-14. If its bullish enough to break $0.16 it may also break the resistance line and we can expect $0.25 short-term and higher targets like $0.50 in the long run.
But
If its bearish and fails at breaking the resistance the price can fall back to $0.07 or even $0.04 in the worst


#AEVO/USDT#AEVO
The price is moving in a descending channel on the 1-hour frame and is expected to continue upwards
We have a trend to stabilize above the moving average 100 again
We have a descending trend on the RSI indicator that supports the rise by breaking it upwards
We have a support area at the lo

#AEVO/USDT#AEVO
The price is moving within a descending channel on the 1-hour frame and is expected to continue lower.
We have a trend to stabilize below the 100 moving average once again.
We have a downtrend on the RSI indicator, supporting the upward move with a break above it.
We have a resistance area

AEVOUSDT WEEKLY MID-TERM TRADEI've been monitoring this coin on a weekly chart for a couple of months and we can see that AEVO seems to have finished its downtrend and bottomed out to start the next accumulation phase . So I'll be adding some AEVO at these lows prices to my SPOT portfolio.
This is a Mid-term trade for the nex

AEVO/USDTKey Level Zone: 0.1250-0.1270
HMT v7 detected. The setup looks promising, supported by a previous upward/downward trend with increasing volume and momentum, presenting an excellent reward-to-risk opportunity.
HMT (High Momentum Trending):
HMT is based on trend, momentum, volume, and market structu

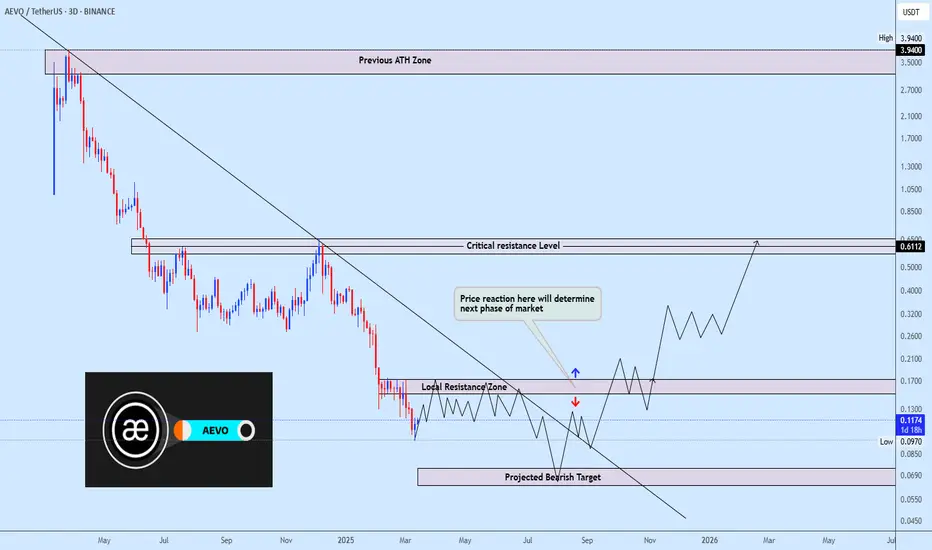
Aevousdt trading ideaAevo exhibit clear downtrend with a descending trendline acting as resistance. Price is currently reacting to a local resistance zone, where a breakout could lead to a test of the critical resistance at 0.6112, while rejection could send it towards the projected bearish target around 0.0580. Price a
See all ideas
Summarizing what the indicators are suggesting.
Oscillators
Neutral
SellBuy
Strong sellStrong buy
Strong sellSellNeutralBuyStrong buy
Oscillators
Neutral
SellBuy
Strong sellStrong buy
Strong sellSellNeutralBuyStrong buy
Summary
Neutral
SellBuy
Strong sellStrong buy
Strong sellSellNeutralBuyStrong buy
Summary
Neutral
SellBuy
Strong sellStrong buy
Strong sellSellNeutralBuyStrong buy
Summary
Neutral
SellBuy
Strong sellStrong buy
Strong sellSellNeutralBuyStrong buy
Moving Averages
Neutral
SellBuy
Strong sellStrong buy
Strong sellSellNeutralBuyStrong buy
Moving Averages
Neutral
SellBuy
Strong sellStrong buy
Strong sellSellNeutralBuyStrong buy
Displays a symbol's price movements over previous years to identify recurring trends.