AEVOUSDT trade ideas
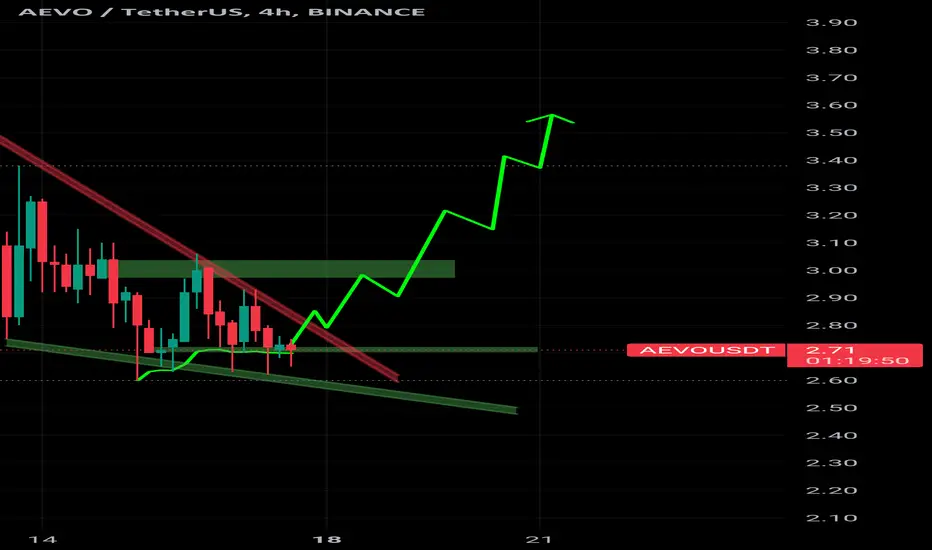
AEVO: Bullish Breakout After First Day on BinanceAEVO is a new cryptocurrency that launched on Binance on March 8, 2023. The price has been trading in a bullish pattern since its launch, forming a descending triangle and a double bottom pattern.
The descending triangle:
The descending triangle is a bearish pattern that is characterized by two converging trendlines, one connecting lower highs and the other connecting higher lows. The price typically breaks down below the lower trendline, signaling a continuation of the downtrend.
The double bottom:
The double bottom is a bullish reversal pattern that is characterized by two consecutive lows, with the second low being higher than the first. The neckline is the horizontal line that connects the two lows.
The fakeout:
The price broke down below the lower trendline of the descending triangle on March 10, 2023. However, this breakdown was a fakeout, as the price quickly reversed and rallied back above the trendline.
The double bottom:
The price then formed a double bottom pattern, with the second low being higher than the first. The price broke out above the neckline of the double bottom pattern on March 14, 2023.
Bullish targets:
The first bullish target is the $2.70 level, which is the top of the descending triangle. Further upside could see the price reach $5.00 or even higher.

AEVO/USDT LAST CHANCE Aevo/USDT appears to be on the verge of a breakout, making it a potentially opportune moment to purchase the dip. Based on my analysis, I anticipate a substantial breakout in the near future, possibly leading to a new all-time high (ATH) for the asset. I foresee a bullish move ranging between 80% to 160%. However, please note that this information is not financial advice; it is advisable to conduct your research (DYOR) before making any investment decisions.

AEVOUSDTAEVOUSDT has given the clean breakout of long term consolidation and strong bullish divergence indicating the buyers are getting ready for strong upside move. And now the market is retesting the broken level. sellers seems to be exhausted.
if this breakout holds the next upside targets will be 3.2 followed by 4

AEVO (new coin) bottomed ?This could be the bottom from the altcoins market.. if this is true.. AEVO can recover from here
About this project:
Aevo is the world's first high-performance decentralized exchange focussed on options and perps trading.
Bullmarket targets on-chart.

AEVO/USDT PLAN The Aevo/USDT market structure currently exhibits a shift towards a bullish sentiment, indicating that the price is likely to approach a retest of the trendline resistance. Analysts estimate a 90% probability of an upcoming breakout, which could potentially lead to a 40-80% bullish movement in the short term. However, it is important to note that this information is for educational purposes only and should not be considered as financial advice.

#AEVO Possible Scenario 🤑🔜⏳#AEVO Possible Scenario 🤑🔜⏳
Pullback from support zone
Waiting for breakout
Waiting for volume breakout
Soon to the Moon 🌙
AEVO 237x Take ProfitAEVO is a high-performance decentralized derivatives exchange platform that focuses on crypto options and perpetual futures trading¹³⁵. It operates on a custom Ethereum rollup called Aevo Chain, built on the OP stack, allowing it to offer lower transaction fees⁴.
The exchange runs on a custom EVM roll-up that rolls up to Ethereum¹³⁵. AEVO operates an off-chain orderbook with on-chain settlements¹³⁵. Since its inception in 2020, AEVO has processed over $10 billion of options trading volume and built up a reputation for trust and security¹.
The AEVO team comes from companies such as Coinbase, Kraken, and Goldman Sachs, and institutions such as Stanford, MIT, and Cornell¹. The platform supports options, perpetual futures, and many other products within a single margin account¹. Combining off-chain matching with on-chain settlement, the platform allows traders to have unparalleled performance and latency while inheriting the security of Ethereum¹.
Source: 3/16/2024
(1) Aevo - Trade Perps, Options and Strategies. www.aevo.xyz
(2) AEVO (AEVO): Ratings & Details | CryptoTotem. cryptototem.com
(3) Aevo Price | Price Today, Live Chart, USD converter, Market .... cryptorank.io
(4) Crypto.com App Lists Aevo (AEVO). crypto.com
(5) Aevo Statistics: Markets, Trading Volume & Trust Score - CoinGecko. www.coingecko.com

im Bullish on $AEVOi entered ASX:AEVO coz of FOMO
But to be honest...we only have to break that major resistance...

AEVO Long Chart PatternFlag pattern on AEVO Crypto.
Order book long orders.
Aim 4.20 or 5
SL 2.50-60

AEVO/USDT : IdeaAevo/usdt
Looking great for mid-term buy
Expecting 8-10$ in mid-term
Let's see
This is not financial advice do your own research before making any decision

Aevo pump soonAevo is very hot dex. This project is backed by big names.
Dydx after launch had 700 mil mcap. Aevo have still 300 mil mcap.
I think Aevo will pump soon to 6-7$.

$AEVO - Swing Position Aevo is the first Derivatives L2 , focused on options & perps trading | Backed by
@paradigm @dragonfly_xyz @Coinbase | Built on @Ethereum 🖤
Trade idea- Buying levels - $2-$3 Range
Stop loss - 1D close below $2
Target - $5 $10 & $20
Targetting SEED_TVCODER77_ETHBTCDATA:1B Mcap atleast.
#AEVO ASX:AEVO #ALTS #CRYPTO

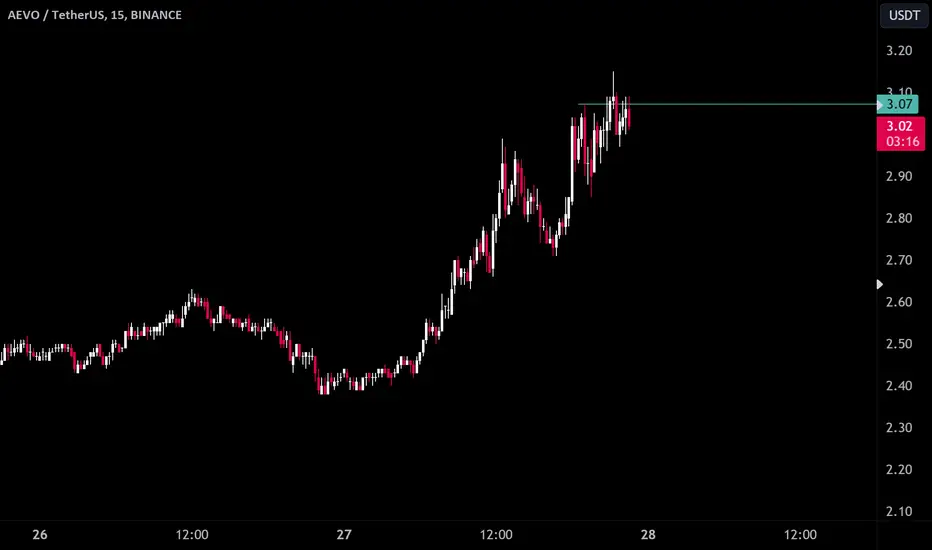
AEVOUSDT.15MINLooking at this updated 15-minute chart of the AEVO/USDT trading pair, I can observe several technical indicators that could inform my trading strategy.
Trendline Break: Initially, the price was in a downtrend, marked by the downward trendline. However, the price has broken through this trendline, indicating a potential reversal or at least a pause in the downtrend.
Support and Resistance Levels: There are clear support and resistance levels identified on the chart. The support at 2.76 USDT hasn't been retested after the initial drop. Resistance levels are marked at 3.14 USDT (R1), 3.26 USDT (R2), and 3.51 USDT (R3). These will serve as my targets for any bullish price movement, with R1 being my first target for taking profits or reassessing the price action.
Bollinger Bands (BB): The price is currently between the middle band (BB:Basis) and the upper band (BB:Upper), which suggests that the volatility is increasing as the price approaches the upper resistance levels. A move above the upper Bollinger Band can often indicate overbought conditions, but in a strong trend, the price can ride the band for an extended period.
RSI (Relative Strength Index): The RSI value of 56.30- indicates that the market is not yet in overbought or oversold territory, which aligns with my interpretation that there is room for movement either way.
Volume: While volume isn't explicitly shown, the price action and candlestick patterns would be more significant if supported by high volume, indicating stronger conviction behind the moves.
Conclusion:
My trading plan, based on this chart, would be to watch for confirmation of the trend reversal, ideally with an increase in volume. I would consider entering a long position with a close above the trendline, targeting the resistance levels as potential exit points. I would also set a stop loss slightly below the support level at 2.76 USDT to minimize potential losses if the downtrend resumes.
I must keep in mind that all trades carry risk and that this analysis should be complemented with other forms of research and market news. Furthermore, as the market is dynamic, I will be ready to reassess my positions should new patterns or indicators suggest a change in market sentiment.
