It is an idea, what about flying in the sky, the dollar, does thIt is an idea, what about flying in the sky, the dollar, does th
DXY trade ideas
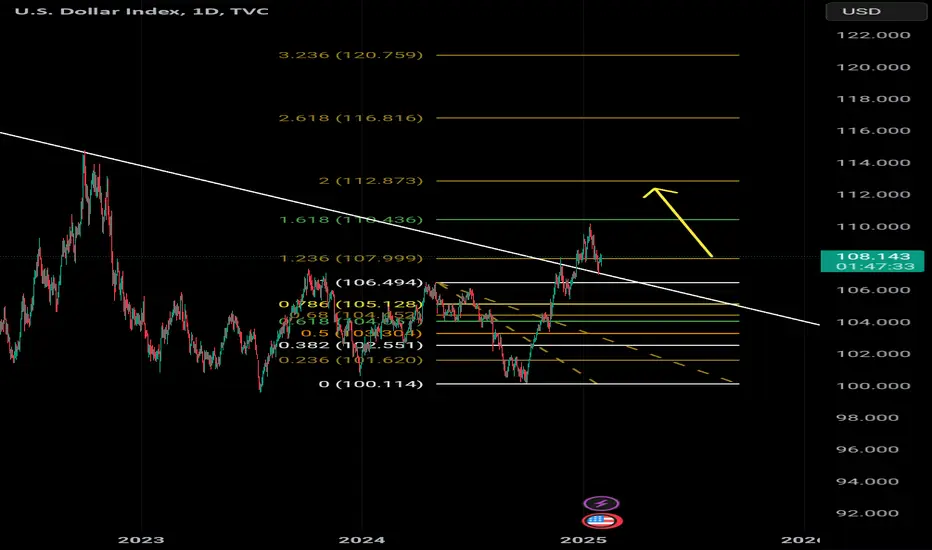
DXY Tests Golden Zone: Key Levels to WatchWe rejected off the golden zone. If we are going to be bullish on risk-on assets, we need to see this remain in a downtrend, as it historically has an inverse relationship with markets like crypto.

Currency linking video I will show this video to my friends for feedback and tips. How i am gonna te fix this problems

Bullish bounce?US Dollar Index (DXY) has bounced off the pivot and could potentially rise to the 1st resistance.
Pivot: 107.16
1st Support: 106.51
1st Resistance: 107.92
Risk Warning:
Trading Forex and CFDs carries a high level of risk to your capital and you should only trade with money you can afford to lose. Trading Forex and CFDs may not be suitable for all investors, so please ensure that you fully understand the risks involved and seek independent advice if necessary.
Disclaimer:
The above opinions given constitute general market commentary, and do not constitute the opinion or advice of IC Markets or any form of personal or investment advice.
Any opinions, news, research, analyses, prices, other information, or links to third-party sites contained on this website are provided on an "as-is" basis, are intended only to be informative, is not an advice nor a recommendation, nor research, or a record of our trading prices, or an offer of, or solicitation for a transaction in any financial instrument and thus should not be treated as such. The information provided does not involve any specific investment objectives, financial situation and needs of any specific person who may receive it. Please be aware, that past performance is not a reliable indicator of future performance and/or results. Past Performance or Forward-looking scenarios based upon the reasonable beliefs of the third-party provider are not a guarantee of future performance. Actual results may differ materially from those anticipated in forward-looking or past performance statements. IC Markets makes no representation or warranty and assumes no liability as to the accuracy or completeness of the information provided, nor any loss arising from any investment based on a recommendation, forecast or any information supplied by any third-party.

Will Trump replace Powell as Fed Chair? Will Trump replace Powell as Fed Chair?
The Federal Reserve has kept interest rates unchanged in its first meeting of the year, but markets are watching for Donald Trump’s response.
Last week, Trump demanded the Fed lower interest rates and talked about how he was more qualified to set interest rates for the country. While he has no direct authority over rate decisions, he does have the power to nominate board members, including the Fed Chair.
With Jerome Powell’s term expiring in May 2026, markets are already speculating on whether he would move to replace him —possibly even before his term ends. Trumps petulance shouldn't be underestimated. A leadership change at the Fed could have significant implications for markets, with a Trump-aligned chair likely to push for lower rates, potentially weakening the dollar while strengthening U.S. equities.

DXY - 1H still bearish...While some signals indicate buy opportunities on the dollar index, I remain skeptical. As mentioned in our 4H analysis, the third bullish leg has been completed, and I expect a deeper correction in CAPITALCOM:DXY .
In the 1H time frame, we can observe that the second reaction to the support zone is significantly weaker than the first. This could indicate a potential breakdown of the support zone, with the index likely falling below the 107 level.
Let’s see how this plays out! Follow for timely updates and expert insights! 🚀


posibility of uptrendIt is expected that after the current corrective pattern is completed, a trend change will form and we will see the start of an upward trend. If the red support area is broken, the continuation of the downward trend will be likely

Dollar Index Bullish to $111.350 (UPDATE)The Dollar has melted down to our second POI, down to $107 & so far has bounced back up. It is possible that price might still drop a little lower, but overall I expect the Dollar to turn bullish again.
We've seen Wave 4 correction complete, followed by a 'BOS' above Wave 3 high confirming the bull run will continue. Retest of supply zone completed, now time for the move up to continue📈

DXY Will Go Down! Short!
Take a look at our analysis for DXY.
Time Frame: 8h
Current Trend: Bearish
Sentiment: Overbought (based on 7-period RSI)
Forecast: Bearish
The market is approaching a significant resistance area 107.947.
Due to the fact that we see a positive bearish reaction from the underlined area, I strongly believe that sellers will manage to push the price all the way down to 106.747 level.
P.S
The term oversold refers to a condition where an asset has traded lower in price and has the potential for a price bounce.
Overbought refers to market scenarios where the instrument is traded considerably higher than its fair value. Overvaluation is caused by market sentiments when there is positive news.
Like and subscribe and comment my ideas if you enjoy them!

Dollar shorts..?I've been waiting on this since last week..
A beautiful model for a Short..it gave me xxx @ around 107.419
So it's a high probability set up let's keep our eyes on it...

DXYDoller index Analysis of Daily time frame .
price near the horizontal support zone also fib retracment 0.382% level.
possibal price touch the fib level 0.382% then continue bulish trend.


DXY - Potential Sell At Key ResistanceThe DXY is approaching a key resistance zone, which has historically acted as a strong supply area. This level has seen multiple price rejections in the past, making it a critical area of interest for potential reversals.
The current uptrend has brought the price back into this resistance zone, but there are signs of potential trend exhaustion as the price tests these levels. If the price confirms rejection with bearish signals, such as reversal candlesticks or divergence on oscillators, we could see a downward move.
I anticipate that, upon rejection from this resistance zone, the DXY may head lower toward the 107.548 level. This setup aligns with the idea of a short-term correction within the broader market context.
Let me know your thoughts on this analysis or if you see a different perspective! Feel free to share your insights in the comments!

DXY may touch 113 in the medium to long termDear Traders,
From what I can see on the DXY chart, there is huge potential for us to see 113 in the medium to long term if we see a rejection of the current zone especially at the rejection block.

DXY Update - H & S Pattern & FEDDear Friends,
Keynote = Fed Interest Rate Decision: 29th of January.
How I see it:
I've indicated the gap on the 1D TF -
It might be insignificant, or
It might only be filled on the next swing return.
The head and shoulder pattern + 1D candle body
close below key support might indicate further downward pressure.
107.000 to 108.000 is a very big key area of confluence.
A strong "breakout and hold" on either side, will offer
strong confirmation of direction.
Thank you for your time reading my analysis !

$DXY Our outlook for the week is that the price will initially rise to a premium PDA, setting the stage for a downward movement toward the discounted PDA of the monthly range, which we consider our long-term target (DoL).

Dollar Bullish BiasThe USD Index will start rallying from the double bottoms. We want to see price rise quickly from Mon 27th Jan, 2025.

Trading Idea for EUR/USD with Confirmation from DXYThe DXY chart shows a QML (Quasimodo Level) already confirmed through a BOS (Break of Structure). The next step is a return to the OTE (Optimal Trade Entry) zone, where the daily order block (OB) is located. On DXY, we expect a reaction to the daily OB or the 4-hour GAP, signaling further index downside and confirming long entries on EUR/USD.
Scenario for EUR/USD:
DXY reacts to the daily OB or 4-hour GAP, confirming its decline.
This confirmation supports opening long positions on EUR/USD.
Entry on EUR/USD is made at the OTE zone from the daily OB.
An additional entry point is the 4-hour FVG on EUR/USD.
Strategy:
Confirmation: Reaction to the daily OB or 4-hour GAP on DXY.
Entry: Long EUR/USD from the daily OB or 4-hour FVG.
Stop-loss: Beyond the OB boundary.
Take-profit: At the true supply level.
Using DXY’s reaction as confirmation helps minimize risks and improves entry precision.


DXYDXY still on a bearish trend looking forward to the next drop this week coming up with CPI news incoming.

dxy long scenario hello traders~~~
dxy long full scenario
1. tp hit and a little correction now
2. after some correction i expect will touch tp3 ( near 111 )
arrow shows correction target
3 if reach tp3 need analyze again ...

DXY - Potential Pull Back before short strategyIn my mind have two scenario .. all with a short view for Dollar.
In the first we can have a strong break of support area directly
In the second we can have a pull back until 108.5 area
In this second way we will have a creation of an H&S pattern
This is my idea.
