US100 - Long DailyUS100 Bullish after strong resistance and breakout of symmetrical/rectangle.
EP: 22147
SL: 21344
TP: 22960
NAS100 trade ideas

NAS100 Possible tradeI originally wanted to go short targeting 22023 and 2180 but i want to risk it and maybe go long off of this

$NAS100 IdeaIf the monthly close occurs as projected, we will confirm a double liquidity purge, signaling a bearish scenario. Additionally, buyer liquidity will have been absorbed, with the price closing within the range, further reinforcing the downside perspective for NAS100. However, we still have one more week to validate this bias. On the daily chart, we will wait for a market structure shift before considering short positions.

NSDQ100 drops on weaker than expected economic dataThe NSDQ (USTec) index pair price action sentiment appears bullish, supported by the longer-term prevailing uptrend. The recent intraday price action appears to be a corrective pullback after reaching the all-time high.
The key trading level is at 21290 level, the consolidation price range and also the previous resistance is now a newly formed support zone. A corrective pullback from the current levels and a bullish bounce back from the 21290 level could target the upside resistance at 21890 followed by the 22090 and 22260 levels over the longer timeframe.
Alternatively, a confirmed loss of the 21290 support and a daily close below that level would negate the bullish outlook opening the way for a further retracement and a retest of the 21045 support level followed by 21680.
This communication is for informational purposes only and should not be viewed as any form of recommendation as to a particular course of action or as investment advice. It is not intended as an offer or solicitation for the purchase or sale of any financial instrument or as an official confirmation of any transaction. Opinions, estimates and assumptions expressed herein are made as of the date of this communication and are subject to change without notice. This communication has been prepared based upon information, including market prices, data and other information, believed to be reliable; however, Trade Nation does not warrant its completeness or accuracy. All market prices and market data contained in or attached to this communication are indicative and subject to change without notice.

Crucial to observe Price action on Monday and TuesdayDisclaimer: This is solely a personal opinion and not investment advice. Please conduct your own assessment before making any decisions.
The market performance last week aligned with prior expectations.
Price maintaining an upward trend from Monday to Thursday. On Friday, prices saw a noticeable pullback; however, the decline was limited and did not break the previous low, remaining above 21,436.
If bearish, next week, the price should break below 21,436 between Monday and Tuesday, with any rebound likely staying below 22,000. If the price successfully breaks below 21,436, short opportunities can be considered in the 21,700–21,950 range, with downside targets at 20,870, 20,648, and 20,549.
However, in my opinion, the probability of this scenario is relatively low at the moment. The market is still maintaining a bullish structure with higher highs and higher lows. It is likely that the price will find support around 21436.
If the price fails to break below 21,436 effectively on Monday or Tuesday and instead rebounds with solid support near this level, the market is more likely to maintain its upward trend. In this case, long opportunities could be considered on dips, with an upside target of 22,300–22,465. If the bulls gain control, there is a high probability that the price will retest 21,950 between Monday and Tuesday. However, if the price fails to retest 21,950 and remains above 21,700, it may indicate weak bullish momentum, suggesting a potential further decline.
Next week, it will be crucial to observe the market’s performance on Monday and Tuesday to further assess its direction.


Nas100 - Weekly OutlookI wont be breaking this one down until smaller TF as this was the exact prediction I anticipated prior this bullish move but I will be looking at the 4H Demand zone to now buy from
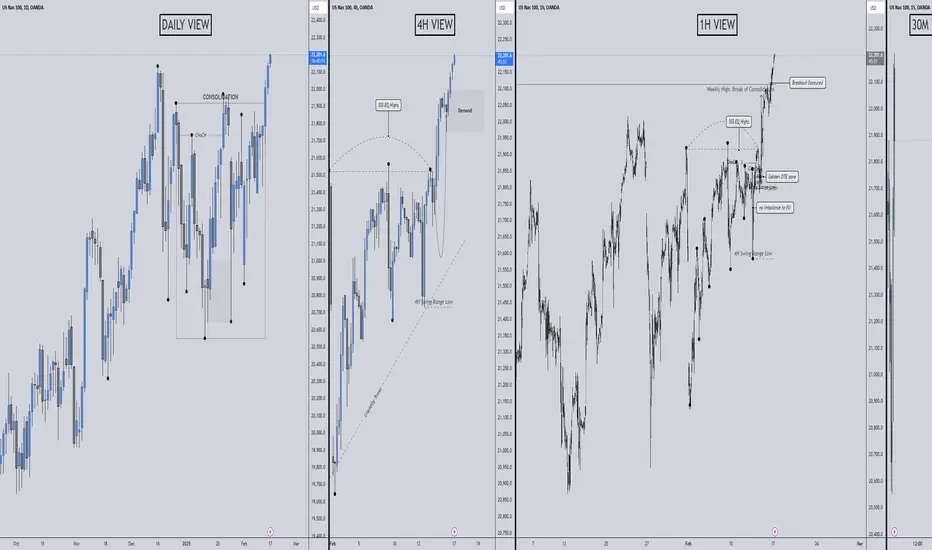
More possibilities here, but overall bullish on nas100From what i am seeing, market strukture looks bullish to me. Now the question is whether markets will make some pullback or just go straight up. I feel like markets will make pullback, take liquidity or fill 4h imbalance.
From fundamental side of thing, the pullback can be caused by 0.9% drop in retail sales. But that's about all of the importance that could support my idea.
Overall, I will be looking for long trades as the US economy appears to be strong despite the increased tariffs and the market structure suggests the same.
Tell me your perspective on the situation, I'd love to learn :)

Remains bullish and wait for reversal signalLast week, both CPI and PPI data came in below expectations, indicating signs of rising inflation. However, the market did not experience a sharp decline; instead, prices held above 21,432, demonstrating strong support.
This market reaction suggests that seller were not willing to enter at this stage. The market maintained its uptrend, broke through previous highs, and reached the target level on Friday, surpassing the 21,968 and 22,100 resistance levels consecutively.
As long as there are no technical signals indicating a market reversal, the overall outlook for next week remains bullish. The next price target is 22,465, and attention should be paid to the market's performance within the 22,300–22,465 range to further assess its direction.
From a long-term perspective, I still believe that U.S. tech stocks are overvalued, and various risk factors could trigger a downturn. And the potential correction could be significant. My specific views can be referenced in my previous market commentary from February 3–7, 2025.
Therefore, when taking long positions, it is crucial to remain vigilant about market sentiment shifts, as the market could reverse at any time. I will wait for technical confirmation on the 4-hour chart and enter short positions once reversal signals appear.

NAS100USD: Retracement to Target Sell Stops Below Support ZoneGreetings Traders,
In today’s analysis on NAS100USD, while the market is currently showing bullish momentum, there are clear signs that we may experience a retracement toward the downside. This move would likely target the discount sell stops below the illustrated support zone, providing an opportunity to align with institutional order flow.
KEY OBSERVATIONS:
Institutional Resistance Zone: A strong order block has formed, creating a significant resistance level that price may struggle to break through. This order block, coupled with the Fair Value Gap (FVG) beneath it, strengthens the bearish case. These two institutional resistance zones suggest a higher likelihood of a retracement.
Premium Price Zone: Price is currently trading in a premium range, a favorable area to monitor for potential selling opportunities upon confirmation.
Liquidity Target : Our primary target is the discount sell stops resting below an engineered support zone. This zone is a key draw on liquidity, where we anticipate significant institutional interest.
TRADING PLAN:
Entry Strategy : Wait for confirmation before entering short positions at the current premium price level.
Targets : Focus on the liquidity pools below the support zone, particularly the discount sell stops, as these represent the main draw on liquidity.
Patience and precision are crucial. By following institutional clues, we can effectively position ourselves for high-probability trades.
Happy Trading!
The Architect 🏛📊

NASDAQ Massive Resistance breakout targeting 23000.Nasdaq / US100 is trading inside a Channel Up, which is testing today its Resistance, the previous higher high of the pattern.
When this took place duringt the previous bullish wave, the price stayed supported by the 1day MA50 and reached the 1.618 Fibonacci extension.
Buy and target 23000.
Follow us, like the idea and leave a comment below!!

$NAS100 Blow-off top🚀 Nasdaq Blow-Off Top in Sight?
The Nasdaq is surging toward 23,000, showing signs of a classic blow-off top—parabolic price action, extreme bullish sentiment, and stretched valuations. Momentum is strong, but volume spikes and bearish divergences suggest exhaustion is near. If FOMO buyers fuel a final push, watch for a sharp reversal as liquidity dries up. A breakdown below key support could trigger a swift correction. Smart money may already be rotating out. Strategy: Tighten stops, consider hedging, and watch for short setups on confirmation of weakness. Is this the market’s last euphoric rally before reality sets in?
#NASDAQ #Stocks #BlowOffTop
InverseTomPip

NAS100The Nasdaq Stock Market is one of the largest stock exchanges in the world, known for its focus on technology and growth-oriented companies. It was the first electronic stock market and continues to be a leader in innovation and trading efficiency. The Nasdaq Composite Index tracks nearly all stocks listed on the exchange, while the Nasdaq-100 includes the largest non-financial companies. Trading on Nasdaq follows regular U.S. market hours, with extended pre-market and after-hours sessions available. Investors closely watch the Nasdaq for trends in the tech sector and overall market performance.

USTEC, NAS100USTEC is in a correction phase. If the price cannot break through the 22110 level, it is expected that the price will drop. Consider selling the red zone.
🔥Trading futures, forex, CFDs and stocks carries a risk of loss.
Please consider carefully whether such trading is suitable for you.
>>GooD Luck 😊
❤️ Like and subscribe to never miss a new idea!

Learn why the Nasdaq 100 could be about to soarThe Nasdaq 100 is showing an ascending triangle pattern, suggesting a breakout toward 23,100. Trade war concerns with Mexico and Canada have eased, while China has worked around tariffs by shifting production to other countries. A break above 21,962 could push prices up 5.3%, but rising inflation near 2.9% might force the Fed to consider rate hikes. Jerome Powell’s testimony tomorrow will give us a better idea of what’s next for markets.
This content is not directed to residents of the EU or UK. Any opinions, news, research, analyses, prices or other information contained on this website is provided as general market commentary and does not constitute investment advice. ThinkMarkets will not accept liability for any loss or damage including, without limitation, to any loss of profit which may arise directly or indirectly from use of or reliance on such information.

Market Alert: Considering Shorting NASDAQ?he NASDAQ is showing signs of potential weakness amid rising bond yields, geopolitical tensions, and mixed earnings reports. Key tech stocks are under pressure, and the index is testing critical support levels.
Why Short NASDAQ Now?
Rising interest rates are weighing on growth stocks.
Overbought conditions in tech suggest a pullback could be imminent.
Bearish technical patterns forming on the daily chart.

NAS100USD / TRADING ABOVE SUPPORT ZONE /4HHELLO EVERYONE
The price has changed direction and is now trading within an ascending channel, which increases the likelihood of a continued bullish trend. However, today’s CPI data release is expected to create market sensitivity and lead to strong price movements.
Technically, as long as the price remains above 21,570, the bullish momentum is likely to continue, with the next target at 21,930 and, if broken, further upside potential toward 22,120. On the other hand, if the price breaks below 21,570 and closes a 4-hour candle beneath this level, a bearish trend could begin, signaling a shift in market sentiment. Given the impact of economic data, increased volatility is expected, and traders should look for confirmation before making decisions.

USNAS100 | Breakout Confirmed! Will ATH Hold or Push Higher?📊 NASDAQ 100 (USNAS100) – Technical Analysis (4H Chart)
🔹 Market Overview:
The price has broken the key resistance zone and stabilized above it, confirming bullish momentum. The bullish volume pushed the price up quickly to reach ATH at 22,100 before facing some resistance.
🔹 Current Price Action:
A correction toward 21,900 is likely before another push higher.
As long as price trades above 21,900 and 21,807, the market remains bullish and can target 22,292 next.
🔥 Potential Bullish Scenario:
✅ As long as price holds above 21,900 - 21,807 → bullish continuation expected!
📌 Targets:
📍 22,100 (ATH Retest)
📍 22,292 (Key Resistance Target)
📍 22,412 (Major Resistance Level & Channel Top)
⚠️ Potential Bearish Scenario:
❌ A 4H close below 21,807 would signal a short-term pullback.
📌 Support Targets:
📍 21,900 (first support zone)
📍 21,807 (critical pivot area, potential bounce zone)
🔑 Key Levels:
📍 Pivot Zone: 21,900 - 21,807
📍 Resistance: 22,100 | 22,292 | 22,412
📍 Support: 21,900 | 21,807 | 21,570
📌 Conclusion:
✅ Bullish bias remains intact while price holds above 21,900.
🚀 Break above 22,100 = new bullish leg toward 22,292+.
⚠️ Failure to hold 21,807 could lead to a drop toward 21,570.
💬 Do you think we break 22,100 or correct first? Drop your thoughts below! 👇👇

NASDAQ Technical AnalysisTrade Setup Overview
Entry Price: 21,530.33
Target Price: 22,232.41
Stop Loss: 21,297.97
Risk-Reward Ratio: 1:3
Trade Type: Long Position
Suggested Position Size: 0.25-0.5% of capital
Timeframe: 1-Hour Chart
Position Sizing and Risk Analysis
Conservative position sizing (0.25-0.5%) indicates proper risk management
Total Risk per Position: 232.36 points (Entry - Stop Loss)
Potential Reward: 702.08 points (Target - Entry)
Maximum capital risk at 0.5% position size provides buffer for market volatility
Technical Timeframe Considerations
4-Hour chart setup suggests a swing trading approach
Longer timeframe reduces noise and false signals
Allows for proper development of price action and trend confirmation
Consider holding position through multiple sessions if needed
Catalyst Analysis
Non-Farm Payroll (NFP) Impact Scenarios
Positive NFP Scenario:
Strong jobs data could accelerate upward momentum
Consider trailing stop adjustment on strong move
Watch for potential extension beyond initial target
Negative NFP Scenario:
Have preset stop loss in place
No emotional attachment to position
Accept defined risk and move on to next opportunity
Trade Management Strategy
Entry Execution
Enter at specified price of 21,530.33
Consider scaling in if market provides opportunity
Maintain discipline on entry price
Position Management
Initial stop loss at 21,297.97 (non-negotiable)
Consider partial profit taking at 1:1 risk-reward
Trail stop loss after significant movement in favor
Maximum hold time based on 4H chart context: 5-7 trading days
Exit Strategy
Primary target: 22,232.41
Consider market context at target approach
Use price action at target level for exit timing
Don't force trades beyond technical invalidation
Risk Management Rules
Strict adherence to position sizing (0.25-0.5%)
No averaging down on losing positions
Respect stop loss level - no exceptions
Consider market hours volatility
Account for pre/post market gaps
Technical Price Levels
Entry Zone: 21,530.33
Critical Support: 21,297.97
Psychological Levels:
21,500
22,000
22,200
Target Zone: 22,232.41
Session Considerations
Monitor pre-market sentiment
Watch correlated markets (S&P 500, DOW)
Consider reduced position size during high-impact news
Be aware of market hours volatility spikes
Trade Invalidation
Clear invalidation below 21,297.97
Technical structure breaks
Significant shift in market sentiment
Unexpected negative catalyst impac
t
Key Reminders
"Live to trade another day" - maintain emotional discipline
NFP is a known catalyst - plan accordingly
4H timeframe requires patience
Stick to planned position size
Monitor correlated tech sectors for confirmation
Remember: Trading success comes from consistent execution of a well-defined plan, not from any single trade outcome.


NASQ 100 - looking to a new higher highHello traders, please feel free to share your trading ideas, and please give a Boost if you agree with my trading plan. My trading strategy is Price Action, which is the simplest strategy of trading on the price movement. A key part of my discipline is Stop Loss set when opening a trading position, which ensures every trading is risk managed. My 1 to 1 trading training is available, please message. Trade well and good luck!

NAS100USD Is Bullish! Buy!
Please, check our technical outlook for NAS100USD.
Time Frame: 9h
Current Trend: Bullish
Sentiment: Oversold (based on 7-period RSI)
Forecast: Bullish
The market is testing a major horizontal structure 21,661.7.
Taking into consideration the structure & trend analysis, I believe that the market will reach 21,981.2 level soon.
P.S
Overbought describes a period of time where there has been a significant and consistent upward move in price over a period of time without much pullback.
Like and subscribe and comment my ideas if you enjoy them!

NAS100USD: CPI Volatility & Institutional Continuation Sell-OffGreetings Traders,
In today’s analysis on NAS100USD, we observe that the market remains bearish following a significant CPI news release. This high-impact event resulted in a sharp bearish displacement, reinforcing the ongoing bearish narrative. Yesterday, I shared an analysis predicting this continued bearishness. For those interested, you’ll find that analysis attached at the end of this description for deeper context.
KEY OBSERVATIONS:
CPI-Induced Displacement : The CPI release triggered a large downward move, forming a massive single candle that left behind a noticeable inefficiency—a Fair Value Gap (FVG).
Liquidity Grab & Fair Valuation: After sell stops were taken, price retraced to fill the FVG, restoring fair valuation. This retracement fully closed the gap, confirming a continuation of bearish order flow.
Premium Price Zone: We are currently in a deep premium price range, which aligns with institutional distribution zones. These areas offer excellent opportunities for confirmation-based sell entries.
TRADING PLAN:
Entry Strategy: Look for confirmation at the current premium price level before entering short positions.
Targets: Focus on discount liquidity pools at lower prices, as these are the areas institutions will likely target to take profits.
By following the institutional flow, we align ourselves with smart money practices, improving our precision and probability of success. Stay patient and disciplined—confirmation is key!
For more context, here’s yesterday’s analysis below.
Happy Trading!
The Architect 🏛📊
