ALGO / USDT : Gearing up for a breakout above Trendline ALGO/USDT: Gearing Up for a Breakout Above Trendline Resistance
ALGO/USDT is shaping up for an exciting move 📈 as it approaches a critical trendline resistance zone 📊. The price has been consolidating tightly, creating the perfect setup for a potential breakout 💥. If the breakout happens, we could see a strong bullish trend unfold 🚀. Keep a close eye 👀 on this pair and wait for confirmation before acting.
Key insights:
1. Trendline resistance: ALGO/USDT is approaching a long-standing trendline that has previously acted as a barrier. A break above this could mark the start of a strong upward move.
2. Volume surge: Watch for a significant increase in trading volume during the breakout to confirm buyer strength 🔥.
3. Bullish signals: Momentum indicators like RSI and MACD are trending positively ⚡, supporting the case for a bullish breakout.
Steps to confirm the breakout:
Look for a clear 4H or daily candle closing above the trendline 📍.
A noticeable spike in volume during the breakout can signal strong buying activity 📊.
A retest of the broken resistance as a new support zone adds credibility to the move ✅.
Be cautious of fake breakouts, such as sharp reversals or wicks above the trendline ⚠️.
Risk management strategies:
Use stop-loss orders to manage your risk effectively 🔒.
Ensure position sizing aligns with your overall trading strategy 🎯.
This analysis is for educational purposes only and not financial advice. Always conduct your own research (DYOR) 🔍 before making investment decisions.
AGLDUSDT trade ideas

AGLD shortAdventure Gold (AGLD) is an Ethereum token that was airdropped to owners of Loot Project NFTs. Loot is a project that generated randomized adventure gear stored on-chain that can serve as the foundation for games built in the future. AGLD can potentially be used as an in-game currency for similar games and projects eventually built on top of the Loot Project.
Short target 1.3 or 1.4 usdt.
spinning in the zone under 1.2 usdt or lower.
This is only my idea guys.
This is not financial advice !
Please do your analysis and consider investing !! Thanks for supp.

AGLD/USDTKey Level Zone: 1.1870 - 1.2050
HMT v5 detected. The setup looks promising, supported by a previous upward/downward trend with increasing volume and momentum, presenting an excellent reward-to-risk opportunity.
HMT (High Momentum Trending):
HMT is based on trend, momentum, volume, and market structure across multiple timeframes. It highlights setups with strong potential for upward movement and higher rewards.
Whenever I spot a signal for my own trading, I’ll share it. Please note that conducting a comprehensive analysis on a single timeframe chart can be quite challenging and sometimes confusing. I appreciate your understanding of the effort involved.
Important Note :
Role of Key Levels:
- These zones are critical for analyzing price trends. If the key level zone holds, the price may continue trending in the expected direction. However, momentum may increase or decrease based on subsequent patterns.
- Breakouts: If the key level zone breaks, it signals a stop-out. For reversal traders, this presents an opportunity to consider switching direction, as the price often retests these zones, which may act as strong support-turned-resistance (or vice versa).
My Trading Rules
Risk Management
- Maximum risk per trade: 2.5%.
- Leverage: 5x.
Exit Strategy
Profit-Taking:
- Sell at least 70% on the 3rd wave up (LTF Wave 5).
- Typically, sell 50% during a high-volume spike.
- Adjust stop-loss to breakeven once the trade achieves a 1.5:1 reward-to-risk ratio.
- If the market shows signs of losing momentum or divergence, ill will exit at breakeven.
The market is highly dynamic and constantly changing. HMT signals and target profit (TP) levels are based on the current price and movement, but market conditions can shift instantly, so it is crucial to remain adaptable and follow the market's movement.
If you find this signal/analysis meaningful, kindly like and share it.
Thank you for your support~
Sharing this with love!
HMT v2.0:
- Major update to the Momentum indicator
- Reduced false signals from inaccurate momentum detection
- New screener with improved accuracy and fewer signals
HMT v3.0:
- Added liquidity factor to enhance trend continuation
- Improved potential for momentum-based plays
- Increased winning probability by reducing entries during peaks
HMT v3.1:
- Enhanced entry confirmation for improved reward-to-risk ratios
HMT v4.0:
- Incorporated buying and selling pressure in lower timeframes to enhance the probability of trending moves while optimizing entry timing and scaling
HMT v4.1:
- Enhanced take-profit (TP) target by incorporating market structure analysis
HMT v5 :
Date: 23/01/2025
- Refined wave analysis for trending conditions
- Incorporated lower timeframe (LTF) momentum to strengthen trend reliability
- Re-aligned and re-balanced entry conditions for improved accuracy

#AGLD/USDT#AGLD
The price is moving in a descending channel on the 1-hour frame and is expected to continue upwards
We have a trend to stabilize above the moving average 100 again
We have a descending trend on the RSI indicator that supports the rise by breaking it upwards
We have a support area at the lower limit of the channel at a price of 1.40
Entry price 1.51
First target 1.60
Second target 1.68
Third target 1.76

AGLDUSDTAGLD was bearish and also had bullish divergence and now it is consolidating. If it breaks the resistance buyers control it

AGLDdaily tf for AGLD looks very promising
as it is shown in the chart, price correction is done and to me looks like indicators are showing that there is will be movements toward HL, in my previous analysis entry target was 1.5536 and it seems that the accuracy was 100% for the entry.
Now, if the price goes higher than 1.6625 then we could 100% say that price will hit 2$
good luck
nfa
dyor

descending triangle a more prominent representation for me
as detecting a pattern is a bit hard for a beginner like me
little bit by bit able to discern some pattern buy rechecking and comparing some charts

AGLD should close 50% of this wickGATEIO:AGLDUSDT
We should come back and close at least 50% of this huge wick on D1
✅Before we start to discuss, I would be glad if you share your opinion on this post's comment section and hit the like button if you enjoyed it.
Thank you.
Possible Targets and explanation idea
➡️Local picture since June we got signals to buy on Trade ON indicator. Strong signal to buy
➡️Usually when we got some huge wick candle it means in that level we got a liquidity. So we should come back and close at least 50% of this wick
➡️Possible retest local downtrend line after FOMC increasing rate in November
➡️50% of June wick is exactly "Exit" line on Take Profit indicator
➡️Trades possible retest 0.28 cents and exit point 0.56 cents
Hope you enjoyed the content I created, You can support with your likes and comments this idea so more people can watch!
✅Disclaimer: Please be aware of the risks involved in trading. This idea was made for educational purposes only not for financial Investment Purposes.
* Look at my ideas about interesting altcoins in the related section down below ↓
* For more ideas please hit "Like" and "Follow"!

#AGLD/USDT Ready to go higher#AGLD
The price is moving in a descending channel on the 1-hour frame and sticking to it well
We have a bounce from the lower limit of the descending channel, this support is at 1.64
We have a downtrend on the RSI indicator that is about to be broken, which supports the rise
We have a trend to stabilize above the moving average 100
Entry price 1.71
First target 1.85
Second target 2.00
Third target 2.20

AGLDhave been monitoring AGLD some days to see if i could find a good long entry point, but my marked entry point was not reached in 1D tf, so i think we must wait some more hours if something will be changed for this trade.
patience pays


AGLD/USDTKey Level Zone : 1.9370 - 1.9530
HMT v4.1 detected. The setup looks promising, supported by a previous upward/downward trend with increasing volume and momentum, presenting an excellent reward-to-risk opportunity.
HMT (High Momentum Trending):
HMT is based on trend, momentum, volume, and market structure across multiple timeframes. It highlights setups with strong potential for upward movement and higher rewards.
Whenever I spot a signal for my own trading, I’ll share it. Please note that conducting a comprehensive analysis on a single timeframe chart can be quite challenging and sometimes confusing. I appreciate your understanding of the effort involved.
Important Note :
Role of Key Levels:
- These zones are critical for analyzing price trends. If the key level zone holds, the price may continue trending in the expected direction. However, momentum may increase or decrease based on subsequent patterns.
- Breakouts: If the key level zone breaks, it signals a stop-out. For reversal traders, this presents an opportunity to consider switching direction, as the price often retests these zones, which may act as strong support-turned-resistance (or vice versa).
My Trading Rules
Risk Management
- Maximum risk per trade: 2.5%.
- Leverage: 5x.
Exit Strategy
Profit-Taking:
- Sell at least 70% on the 3rd wave up (LTF Wave 5).
- Typically, sell 50% during a high-volume spike.
- Adjust stop-loss to breakeven once the trade achieves a 1.5:1 reward-to-risk ratio.
- If the market shows signs of losing momentum or divergence, ill will exit at breakeven.
The market is highly dynamic and constantly changing. HMT signals and target profit (TP) levels are based on the current price and movement, but market conditions can shift instantly, so it is crucial to remain adaptable and follow the market's movement.
If you find this signal/analysis meaningful, kindly like and share it.
Thank you for your support~
Sharing this with love!
HMT v2.0:
- Major update to the Momentum indicator
- Reduced false signals from inaccurate momentum detection
- New screener with improved accuracy and fewer signals
HMT v3.0:
- Added liquidity factor to enhance trend continuation
- Improved potential for momentum-based plays
- Increased winning probability by reducing entries during peaks
HMT v3.1:
- Enhanced entry confirmation for improved reward-to-risk ratios
HMT v4.0:
- Incorporated buying and selling pressure in lower timeframes to enhance the probability of trending moves while optimizing entry timing and scaling
HMT v4.1:
- Enhanced take-profit (TP) target by incorporating market structure analysis

AGLD Overview!BINANCE:AGLDUSDT
we can see that AGLD is in a bullish channel!
the price is near It's bottom So it should be able to start a bullish Movement from Here!👍
⚠️ Disclaimer:
This is not financial advice. Always manage your risks and trade responsibly.
👉 Follow me for daily updates,
💬 Comment and like to share your thoughts,
📌 And check the link in my bio for even more resources!
Let’s navigate the markets together—join the journey today! 💹✨

AGLDUSDT Long Setup - Spot BINANCE:AGLDUSDT
📈Which side you pick?
Bull or Bear
Low-risk status: 3x-4x Leverage
Mid-risk status: 5x-8x Leverage
(For beginners, I suggest low risk status)
👾Note: The setup is active but expect the uncertain phase as well. also movement lines drawn to predict future price reactions are relative and approximate.
➡️Entry Area: 1 step now
Yellow zone: 2nd step = 2.61-2.32
⚡️TP:
3.13
3.55
4.13
🔴SL:
1.99
🧐The Alternate scenario:
If the price stabilizes against the direction of the position, below or above the trigger zone, the setup will be canceled.

AGLD/USDT, Ascending Channel with 2:6 Risk-Reward SetupThis chart displays an Ascending Channel Pattern where the price is trending upward within parallel support and resistance lines. The long position designed here follows a 2:6 risk-reward ratio , indicating a calculated trade setup with a potential 50% profit at the target price of $3.717 and a controlled 18% loss at the stop-loss of $2.016 .
The ascending channel suggests bullish momentum, and the strategy aligns with a breakout continuation toward the upper resistance level. However, if the price fails to sustain above the lower trendline, the trade could hit the stop-loss. This setup offers a favorable risk-reward profile for traders looking to capitalize on the channel's upward trajectory.

AGLD looks bullish (1D)It appears that AGLD is forming a triangle, with wave E of this triangle not yet complete.
If it reaches the green zone, we will look for buy/long positions.
The targets are marked on the chart.
A daily candle closing below the invalidation level will invalidate this analysis.
For risk management, please don't forget stop loss and capital management
When we reach the first target, save some profit and then change the stop to entry
Comment if you have any questions
Thank You

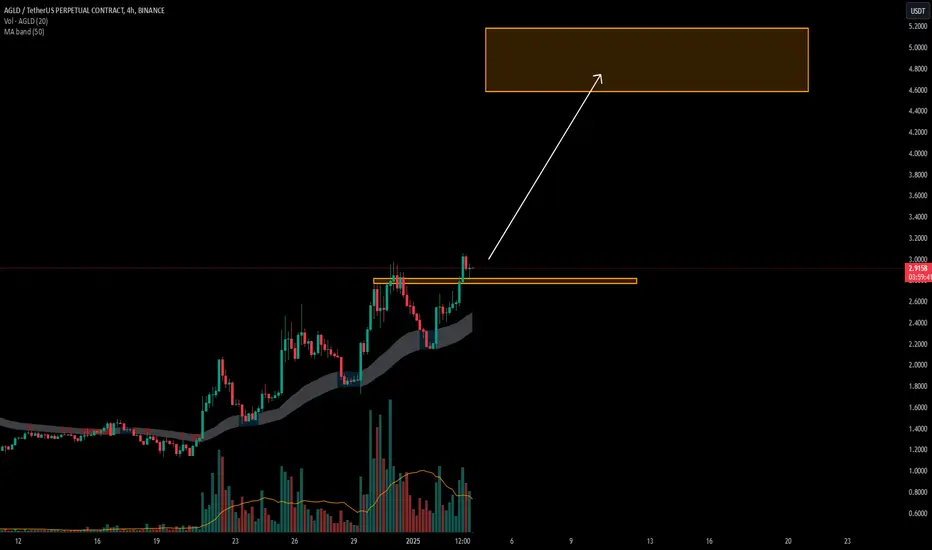
AGLD/USDTKey Level Zone : 2.770-2.820
HMT v3.1 detected. The setup looks promising, supported by a previous upward/downward trend with increasing volume and momentum, presenting an excellent reward-to-risk opportunity.
HMT (High Momentum Trending):
HMT is based on trend, momentum, volume, and market structure across multiple timeframes. It highlights setups with strong potential for upward movement and higher rewards.
Whenever I spot a signal for my own trading, I’ll share it. Please note that conducting a comprehensive analysis on a single timeframe chart can be quite challenging and sometimes confusing. I appreciate your understanding of the effort involved.
Important Note :
Role of Key Levels:
- These zones are critical for analyzing price trends. If the key level zone holds, the price may continue trending in the expected direction. However, momentum may increase or decrease based on subsequent patterns.
- Breakouts: If the key level zone breaks, it signals a stop-out. For reversal traders, this presents an opportunity to consider switching direction, as the price often retests these zones, which may act as strong support-turned-resistance (or vice versa).
My Trading Rules
Risk Management
- Maximum risk per trade: 2.5%.
- Leverage: 5x.
Exit Strategy
Profit-Taking:
- Sell at least 70% on the 3rd wave up (LTF Wave 5).
- Typically, sell 50% during a high-volume spike.
- Adjust stop-loss to breakeven once the trade achieves a 1.5:1 reward-to-risk ratio.
- If the market shows signs of losing momentum or divergence, ill will exit at breakeven.
The market is highly dynamic and constantly changing. HMT signals and target profit (TP) levels are based on the current price and movement, but market conditions can shift instantly, so it is crucial to remain adaptable and follow the market's movement.
If you find this signal/analysis meaningful, kindly like and share it.
Thank you for your support~
Sharing this with love!
HMT v2.0:
- Major update to the Momentum indicator
- Reduced false signals from inaccurate momentum detection
- New screener with improved accuracy and fewer signals
HMT v3.0:
- Added liquidity factor to enhance trend continuation
- Improved potential for momentum-based plays
- Increased winning probability by reducing entries during peaks
HMT v3.1:
- Enhanced entry confirmation for improved reward-to-risk ratios
Prepare for the New Wave with AGLDUSDT
🌟 Prepare for the New Wave with AGLDUSDT! 🌟
🌍 Market Overview:
AGLDUSDT is setting up for its next big move on the W (Weekly) timeframe. This is a great chance to accumulate and hold for significant potential gains as the new wave unfolds.
📊 Trade Plan:
📌 Entry: $1.1 - $1.3 – A key range to position yourself early.
🎯 Target: 2x to 5x – Aiming for exponential returns as the trend strengthens.
⏳ Hold Time: 5 weeks – Strategic mid-term hold to align with the weekly cycle.
🔍 Strategy Insights:
Using my custom tool RainBow MG3, this setup has been identified as a high-probability opportunity.
Market sentiment and technical indicators suggest strong upside potential with manageable risk.
🚀 What You Should Do Next:
💬 Get in touch if you’d like to learn more about my strategies or need support!
💡 Note: This is not financial advice. Always DYOR before making investment decisions.
🔥 AGLDUSDT is gearing up for massive growth – Are you ready? 🔥

ALGD, cup and handle could see this coin soarI prefer to keep things simple when conducting analysis. I sift through a number of indicators until I find my favourite few that when used together often 'jive' creating a harmony and increased confidence in an up, or downward trajectory. This time, the most standout items is the Cup and Handle, a labelled in the diagram. Drawing a line that is equal to the height of the cup to the neckline and repositioning it to the neckline and up, we could see significant all time new highs here. The pattern is robust and holds up well. Other coins have seen similar patterns such as BTC, so it would make sense also here. Good luck, follow for more.

Adventure Gold AGLD price medium-term tradeWe don't know who “breathed life” into #AGLD and why)
⁉️(If you know, write in the comments), but the “strength” in the asset is visible, so you can trade.
But given the fact that we expect a possible price drop 💰 CRYPTOCAP:BTC ⬇️
📊and it is not fully known how altcoins will react to such a maneuver.
Therefore, for now, we are ready to try the OKX:AGLDUSDT trade like on the chart with a very low pending limit order.
And then we will adjust and maneuver according to the situation)
_____________________
Did you like our analysis? Leave a comment, like, and follow to get more

AGLD/USDTKey Level Zone : 2.340-2.440
HMT v3.0 detected. The setup looks promising, supported by a previous upward/downward trend with increasing volume and momentum, presenting an excellent reward-to-risk opportunity.
HMT (High Momentum Trending):
HMT is based on trend, momentum, volume, and market structure across multiple timeframes. It highlights setups with strong potential for upward movement and higher rewards.
Whenever I spot a signal for my own trading, I’ll share it. Please note that conducting a comprehensive analysis on a single timeframe chart can be quite challenging and sometimes confusing. I appreciate your understanding of the effort involved.
If you find this signal/analysis meaningful, kindly like and share it.
Thank you for your support~
Sharing this with love!
HMT v2.0:
- Major update to the Momentum indicator
- Reduced false signals from inaccurate momentum detection
- New screener with improved accuracy and fewer signals
HMT v3.0:
- Added liquidity factor to enhance trend continuation
- Improved potential for momentum-based plays
- Increased winning probability by reducing entries during peaks

Adventure Gold (AGLD) - Cup and Handle** Near term forecast, days ahead **
On the above weekly chart price action has corrected 70% since early summer. A number of reasons now exist to consider a long position. They include:
1) Price action and RSI resistance breakouts.
2) Support confirmation on past resistance.
3) Cup and Handle pattern confirmation with 100% forecast.
Is it possible price action continue to correct? Sure.
Is it probable? No.
Ww

agld - boxTake a closer look at the agld box, after breaking through on the senior TF 3D, the price returned and tested the $1.85 level
You can compare it with #uxlink in terms of structure and capitalization
