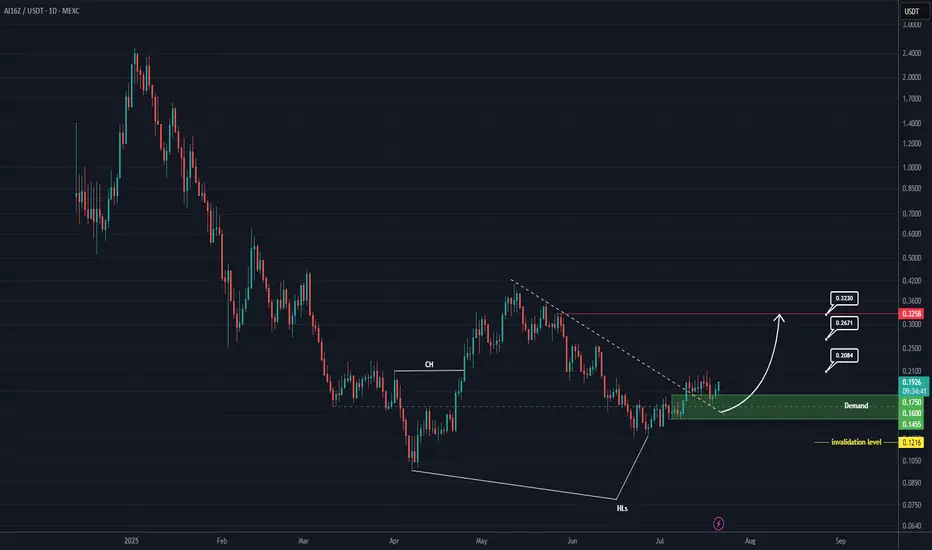
AI16Z Analysis (1D)Given the bullish CH, the breakout of the trendline, and the formation of a support zone, it appears that this token is aiming to move toward the targets marked on the chart.
Additionally, a double bottom pattern is visible at the lows, and higher lows have been recorded for this asset.
A daily candle closing below the invalidation level would invalidate this analysis.
For risk management, please don't forget stop loss and capital management
When we reach the first target, save some profit and then change the stop to entry
Comment if you have any questions
Thank You
AI16ZUSDT.P trade ideas
$AI16Z Setup Looks Prime, 40% Move Possible$AI16Z is gearing up for a breakout.
After a long downtrend inside a falling channel, the price has been consolidating in a tight range, forming a triangle pattern. The structure shows signs of accumulation, with buyers stepping in near the $0.14–$0.15 zone repeatedly.
Now, price is pushing against the trendline resistance. A clean breakout above this level, followed by a successful retest, could signal a trend reversal.
Key Breakout Level: $0.175
Target Zone: $0.20 – $0.26
Invalidation: Close below $0.145
This setup could lead to a strong move in the coming sessions if volume confirms.
DYOR, NFA
#ai16z #Altseason2025

Ai16z Trade plan updatedbefore my previous update on this coin that the wave is unfolding so after the recent decline we have retested the .618 golden fib traders can start to accumulate again at this stage for the upcoming wave 3 which will be explosive. I Know alot of u are sacred rn due to market uncertainty but I tell u the wave 2 is always a tricky wave to have it will test u deep that u will sell at loss
the sl and tp are given in the chart

ai16z#AI16Z has dropped as expected into the buy zone, completing a clean 1-2 setup.
It now presents a golden chance for a strong rally, likely targeting a new ATH as the AI-Agents narrative gears up.
Key confirmation and invalidation levels are on the chart.
#ai16z

Ai16Z trade planthis coin has completed 5 waves move up from the lows creating a complete strong wave 1
and now the wave 2 is almost over traders can enter in this coin for an explosive wave 3 towards upside targeting 1.50$ that is 43 RR setup, and it will come very fast

AI16Z SHORT RESULT Price had began trading in a major falling channel and also broken down a minor ascending channel and successfully retested it, showing iminent signs of dump and breakdown of the support.
Just as it Did.🔥✅
_THE_KLASSIC_TRADER_.

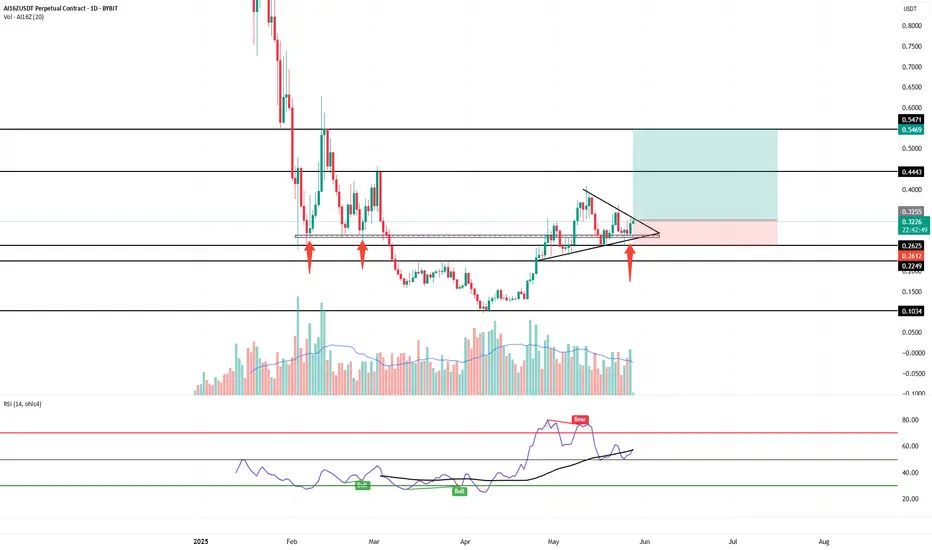
Ai16zusdt long volume is increasing forming symmetrical triangle take a long put stoploss below 0.2612 if daily candle close below this price take profit will be 0.4443 - 0.5469 strong support at 0.2852 which working excellent this is not financial advice do your own research thank you
$AI16ZUSDT – Strong Technical Structure$AI16Z is currently holding well above the ascending trendline, with price consolidating just above a key support zone around $0.279–$0.296.
- Trendline support remains intact
- Holding above the 100 EMA (purple) on the 8H chart
- Breakout from this accumulation range could lead to strong upside momentum
Targets:
• $0.388
• $0.483
• $0.623
This setup is offering a low-risk entry with a high reward potential — keep an eye on volume confirmation for the breakout.

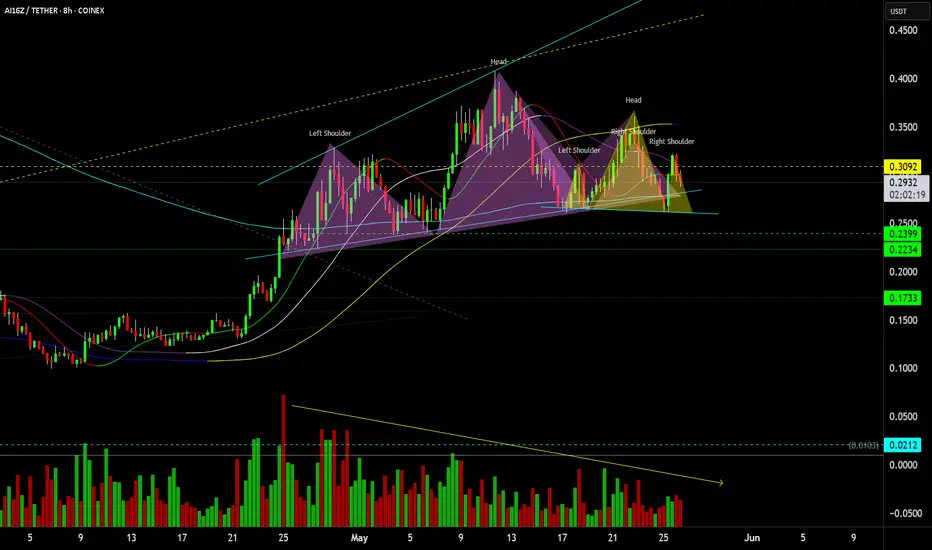
$Ai16z Multi Head & Shoulders top HTFAi16z has formed a HTF Head & Shoulders top with another Head & Shoulders forming within the right shoulder of the HTF H&S with declining volume over the primary formation, all within an Expanding Broadening Wedge top
AI16Z: The Bullish Setup#AI16Z
AI16Z, the leader of AI-Agents, shows a short-term bearish setup followed by a strong long-term bullish potential.
After a motive rise in April - May, it entered a correction and likely in a wave (b).
$0.20 : $0.17 is a key entry zone.
Breaking $0.10 invalidates the idea.

AI16ZUSDT – Setting Up Like PEPE - 3x Potential!Given recent market behavior and the strength behind some reversals, I’m expecting COINEX:AI16ZUSDT to follow a similar path.
Picked up a small bag here—will look to add either above the orange line or on a retest of the Monthly Open.
Structurally, this setup reminds me a lot of $PEPE.

#AI16Z PUMP??!!!I think ai16z can pump very good but look at ETH
ETH can a fine modification from 2600-2750 to 2000-2150
Find the best price to buy But be careful not to be late.

AI16Z Forming Cup and Handle Pattern🚨 $AI16Z Forming Cup and Handle Pattern 🚨
$AI16Z is forming a cup and handle pattern and is currently waiting for a breakout above the red resistance zone. If the breakout is confirmed, the target will be the green line level.
📈 Technical Overview:
Pattern: Cup and Handle
Resistance Zone: Red area currently being tested.
🎯 Breakout Target: Green line level upon confirmation.

AI16Z Breakout Confirmed – Eyes on $1.15 Target$AI16Z has successfully broken above a key descending resistance line, signaling a potential major trend reversal after a prolonged downtrend.
After the breakout, the price is now testing a minor resistance zone. Holding above this zone could open the door for a strong upside move toward the next higher targets (highlighted in blue).
The structure looks bullish as long as price stays above the minor resistance area.
DYOR, NFA

#AI16ZUSDT remains in a bearish momentum
📉 SHORT BYBIT:AI16ZUSDT.P from $0.1544
⚡️ Stop loss $0.1582
🕒 Timeframe: 1H
✅ Overview BYBIT:AI16ZUSDT.P
➡️ Price continues in a downtrend, breaking key support levels.
➡️ POC: $0.1615 marks a high-volume area where price was rejected, indicating strong selling pressure.
➡️ Resistance at $0.1582 — expect rejection on retest.
➡️ Entry zone: $0.1544, but wait for confirmation before entering!
➡️ Targeting TP1: $0.1510 and TP2: $0.1485 on further downside movement.
📍 Important Note: Watch for confirmation levels before entering! Do not enter too early.
🎯 Take Profit Targets:
💎 TP 1: $0.1510
💎 TP 2: $0.1485
⚡️ Plan:
➡️ Wait for confirmation before entering at $0.1544.
➡️ Stop loss $0.1582 — above resistance.
➡️ Take profits at $0.1510 and $0.1485.
🚀 BYBIT:AI16ZUSDT.P remains in a bearish momentum — follow the plan after confirmation!

Returning Bounce for AI16ZA16Z/USDT looks like it’s forming a classic cup and handle pattern, with the cup already well-shaped and price going for round 4 testing resistance at $0.22. A healthy pullback would sett up a potential breakout. If it clears $0.225 with strong volume, the measured move suggests a run toward $0.26-$0.30.
RSI isn’t fully overheated yet, but a rejection here without solid support could see the pattern fail below $0.185. If BTC stays stable, this setup has a decent chance of playing out. If not, well, it can join the pile of crushed dreams 2025 has produced.

$AI16ZUSDT long setup active – targeting a short-term 2x move.Starting to build a small position on $AI16ZUSDT.
Seems like a reasonable setup, considering how CRYPTOCAP:SOL has been performing and the fact that CRYPTOCAP:BTC remains in an active bullish trend.
📌 **Bidding as low as $0.18** in case we get a dip into the 12H block, but not counting on it.
✅ **Trade is now active.**

AI16Z BREAKOUT ALERT! MASSIVE UPSIDE POTENTIAL! 🔥 AI16Z/USDT is primed for an explosive move! The 4H chart is showing a textbook bullish breakout from a descending triangle, and the technicals are lining up for a massive rally! If you’ve been waiting for the perfect long entry, THIS IS IT! 🎯
📊 Why AI16Z is the Next Big Thing:
✅ AI + Crypto Fusion: AI16Z is a cutting-edge project harnessing artificial intelligence to optimize blockchain efficiency and automate smart contract interactions. AI is the future, and this token is right at the forefront of the revolution!
✅ Massive Breakout Incoming: After weeks of consolidation, AI16Z is breaking out of a descending triangle with strong volume confirmation. This setup historically leads to massive upside moves! 📈
✅ Bullish Indicators Everywhere: 🔹 Buy signals firing on multiple timeframes.
🔹 Momentum indicators flipping bullish – MACD, RSI, and WaveTrend all show upward momentum!
🔹 Bottom structure confirmed – Smart money is accumulating at key levels.
🎯 PRICE TARGETS:
📌 First target: $0.24 - $0.26
📌 Second target: $0.30+ 🚀
📌 Moon target: $0.35+ 🌕
📢 How to Trade This:
🔹 Long AI16Z now while it’s still early!
🔹 Set stop-loss below $0.178 to manage risk.
🔹 Ride the wave to the target zone and secure profits along the way!
🔔 Don't miss out on this golden opportunity! AI16Z is ready to explode, and this is your chance to ride the trend early before the FOMO kicks in! Let’s send it! 🚀🔥
#AI16Z #Crypto #Altcoins #Trading #Breakout #CryptoSignals #Bullish

#AI16ZUSDT is setting up for a breakout📉 Long BYBIT:AI16ZUSDT.P from $0,2037
🛡 Stop loss $0,1985
1h Timeframe
⚡ Plan:
➡️ Waiting for consolidation near resistance and increased buying activity before the breakout.
➡️ Expecting an impulsive upward move as buy orders accumulate.
🎯 TP Targets:
💎 TP 1: $0,2072
💎 TP 2: $0,2100
💎 TP 3: $0,2125
🚀 BYBIT:AI16ZUSDT.P is setting up for a breakout — preparing for an upward move!

$AI16Z ─ Wyckoff Accumulation Schematic #1 ─ Secondary OptionAIZ16 Secondary Idea ─ Wyckoff Accumulation Schematic #1
------------
------------
Note:
Long trade is the most positive outcome possible.
As always, my play is:
✅ 50% out at TP1
✅ Move SL to entry
✅ Pre-set the rest of the position across remaining TPs
It's important to take profits along the way and not turn a winning trade into a losing trade.

$AI16Z ─ Wyckoff Accumulation Schematic #1$AIZ16 Primary Idea ─ Wyckoff Accumulation Schematic #1
------------
------------
Note:
This is the most positive outcome possible.
As always, my play is:
✅ 50% out at TP1
✅ Move SL to entry
✅ Pre-set the rest of the position across remaining TPs
It's important to take profits along the way and not turn a winning trade into a losing trade.

High Volume Bullish Long SetupThis strategy has been tested and shows a high win rate, making it a compelling play in today's market conditions. The high volume further minimizes slippage and validates the strength of the move, giving traders confidence in the potential for success.

Ai16z levels$0.40 cents is now broken this is a major level that we have been seeing liquidity at. I have marked a few more levels on chart .45 and .54 this goes back to launch in Nov 2024 i have drawn a yellow line with my ides of a rejection at .45 then a bounce of .40 and if we break through a target or TP1 at .54 cent
