AI ( SPOT )BINANCE:AIUSDT
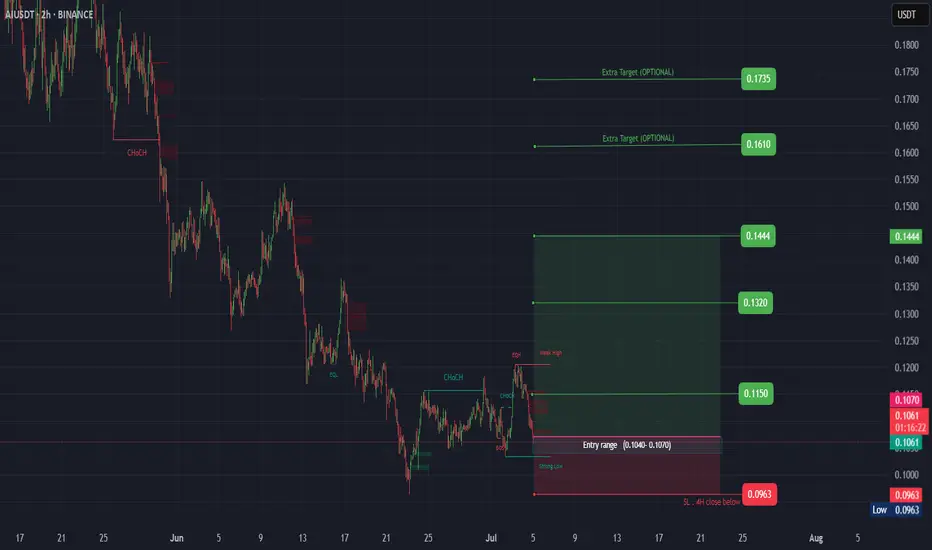
#AI/ USDT
Entry( 0.1040- 0.1070)
SL 4H close below 0.0963
T1 0.1150
T2 0.1320
T3 0.1444
_______________________________________________________
Golden Advices.
********************
* collect the coin slowly in the entry range.
* Please calculate your losses before the entry.
* Do not enter any trade you find it not suitable for you.
* No FOMO - No Rush , it is a long journey.
AIUSDT trade ideas
AI Looks Bullish (12H)The AI correction has started from the point marked as "start" on the chart.
It seems that wave C has completed, as its time cycle has finished and the price has reclaimed key levels.
As long as the green zone holds, the price can move toward the targets and the red box.
The targets are marked on the chart.
A daily candle closing below the invalidation level will invalidate this analysis.
For risk management, please don't forget stop loss and capital management
Comment if you have any questions
Thank You

AIUSDT Forming Falling ChannelAIUSDT is capturing trader interest with a well-defined falling wedge pattern, a strong technical signal that often precedes a major bullish reversal. This setup shows the price compressing within converging trendlines while volume remains supportive, hinting at an upcoming breakout. With expectations for a 90% to 100% gain once the wedge resistance is breached, this pair stands out for swing traders seeking high-probability crypto setups.
The AI narrative continues to gain momentum in the crypto market, and AIUSDT has benefited from this growing sector trend. As blockchain projects focusing on artificial intelligence integrations expand, more investors are looking for exposure to tokens that could lead the AI revolution in decentralized applications. This increasing investor confidence is reflected in the steady accumulation during the wedge formation, showing that buyers are positioning for a breakout.
Traders should closely monitor how the price behaves at the wedge resistance line, as a clean breakout with strong volume could trigger the expected upside move. Confirmations like bullish retests and a surge in trading volume can add conviction to the setup. Risk management remains key, with well-placed stop-losses below the wedge support to protect capital while targeting the full measured move potential.
✅ Show your support by hitting the like button and
✅ Leaving a comment below! (What is You opinion about this Coin)
Your feedback and engagement keep me inspired to share more insightful market analysis with you!

AI (SPOT ) 15min Time frameBINANCE:AIUSDT
#AI/ USDT
Entry same as chart
SL 15MIN close below (Same as chart)
Target same as chart
_______________________________________________________
Golden Advices.
********************
* collect the coin slowly in the entry range.
* Please calculate your losses before the entry.
* Do not enter any trade you find it not suitable for you.
* No FOMO - No Rush , it is a long journey.

Buy### Important and main block order ### can cause a return and reaction to the level. ### In the low time frame, wait for the first ceiling to break and trade when hitting the block!!!! ###buy ###choch

AIUSDT Wave Projection with Bullish SetupAIUSDT has completed a corrective W-X-Y structure near the immediate demand zone, marking a key reversal base. Price is now transitioning into a fresh impulsive wave, with Fibonacci alignment suggesting a bullish extension phase.
Initial impulse is forming cleanly with strong confluence at 0.82 USDT (intermediate target), and extended projections pointing towards 3.77 and 9.04 USDT respectively. Expect resistance at 2.58 USDT, which coincides with the external supply zone—ideal for profit-booking or confirming continuation.
Bullish entries remain valid on successful retests of the 0.2093 support, with invalidation below this level. As long as structure remains intact, this setup favors a multi-leg rally driven by wave symmetry and fib confluence.

AIUSDT trade opportunityAIUSDT has ended its downtrend with a breakout above the downtrend line, initiating a fresh impulsive wave.
The immediate buyback zone offers a strong re-accumulation opportunity, while the landing zone serves as the next profit target.
For the bullish outlook to remain intact, the internal demand zone must hold as a key support level.


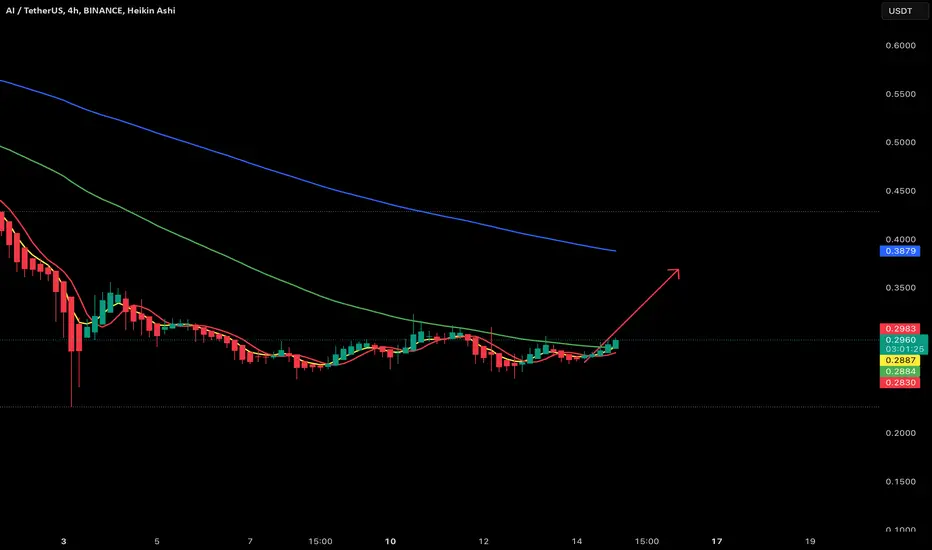
BUY SCALPING SPOT AIUSDT SIGNAL🚀 BUY SCALPING SPOT AIUSDT SIGNAL
📢 Short-term scalping opportunity for AIUSDT – Quick execution for optimal gains!
📌 Strategy & Trade Plan
✔ Scalping Spot Trade within 1-2 days
✔ Targeting 30-35% profit, exit quickly when the target is reached
✔ Signal expires automatically after 2-3 days if the target is not met
📌 Trade Plan
📍 Trade Type: Scalping Spot
📍 Entry Point: $0.287
📍 Target: 35% profit
📍 Hold Time: 2-3 days, after which the signal is automatically invalidated
💡 Key Considerations
📍 Monitor price action closely to exit at the right time
📍 Exit early if momentum weakens before reaching the target
📍 Use stop-loss to protect capital
🔥 AIUSDT is in a prime scalping zone – Execute quickly to maximize gains! 🚀
AIUSDT 3DAI ~ 3D Analysis
#AI This is the lowest support block for now, buy from here if you still have a Conviction on this Coin with a minimum target of 15%+

AI TOKEN: MAJOR ACCUMULATION COMPLETE - BREAKOUT IMMINENT $AI/USDT 1D Analysis
🎯 STRONG ACCUMULATION PATTERN
Current Status:
• Price: $0.6059 (-0.08%)
• Volume: 5.45M
• Rising trendline support (gray)
• Major resistance: $0.8-1.0 (descending line)
KEY ZONES:
• Historical ATH: $1.60-1.80
• Accumulation: $0.35-0.45 (completed)
• Current Support: $0.60
FORECAST (brown projection):
- Breaking descending resistance
- Targeting ATH zone $1.60-1.80
- Pattern suggests strong upside potential
STRATEGY:
• Buy Zone: $0.55-0.60
• Stop Loss: < $0.51
• Targets: $1.00, $1.60, $1.80
• R:R = 1:4
#Crypto #TechnicalAnalysis #Trading

AI Analysis (1D)It seems the AI is completing an expanding pattern in the form of wave b of B.
The red zone is where wave C of this expanding pattern, which is a diamond-shaped diametric, could potentially end.
The safe zone for rebuying is the green zone, which acts as an ideal order block.
Trigger a position whenever you enter.
Let's see what happens next.
For risk management, please don't forget stop loss and capital management
Comment if you have any questions
Thank You

Alikze »» AI| Bullish Scenario - 1H🔍 Technical analysis: Bullish Scenario - 1H
📣 BINANCE:AIUSDT
🟢 If this price reversal meets support and reversal to the green box area and the Invalidation LVL bar is not touched. The currency correction is complete.
🟢 In the medium term, it will be ready to continue the upward rally.
🟢 If the area is touched. The correction will continue, which in the higher time frame can continue to the bottom of the ascending channel and the blue bar of the 0.39 range and be ready to continue the upward trend by forming a reversal pattern.
💎 The second scenario, if the Entry Area area is touched, it can have an upward trend in the short term by creating demand.
💎 In addition, if the Entry Area is broken, there is a possibility of further correction.
»»»«««»»»«««»»»«««
Please support this idea 💡 with a LIKE 👍 and COMMENT 💬 if you find it useful and Click "Follow" on our profile if you'd like these trade ideas delivered straight to your email 📧 in the future.
Thanks for your continued support.🙏
Best Regards,❤️
Alikze.
»»»«««»»»«««»»»«««

TradeCityPro | AIUSDT Attempting to Break the Daily Box👋 Welcome to TradeCityPro Channel!
Let’s analyze one of the coins in the AI and big data category to stay prepared if the AI hype resurfaces.
🌐 Overview Bitcoin
As usual, before analyzing our altcoin, we’ll first take a look at Bitcoin on the 1-hour timeframe. The 99.485 trigger was broken but quickly dropped back below, with a sharp pullback to 97.434, which could be considered a fake breakout.
If this movement is treated as a fake breakout, switching to the 15-minute timeframe shows that the fake breakout trigger is 100.117. Once this level is broken, you can re-enter, and if you missed the position, it provides a new trigger point.
📊 Weekly Timeframe
AIUSDT is a newly listed coin with limited data, so technical analysis options are somewhat restricted.
This coin has broken out of its 100-day box between 0.3306 and 0.5059 but faced rejection at the significant resistance of 0.8228, pulling back to the 0.5059 zone.
It’s worth noting that while many coins have re-entered their previously broken boxes, this coin is holding a higher level, which is a positive sign.
If you’re holding this coin, it’s recommended to sell below 0.3306 and exit. For re-entry, wait for a confirmed breakout above 0.8228, with a reliable stop-loss at 0.3306 (or a riskier one at 0.5059).
📈 Daily Timeframe
After breaking the 0.5375 resistance—our significant daily box ceiling—AIUSDT moved to 0.8228 but was rejected and entered its broader range.
Examining the fake breakouts around the 0.3448 support shows that the second fake breakout led to a trend reversal. Fake breakouts often initiate new trends.
Currently, the 0.8228 resistance level, previously a support, has become a key resistance.
During this upward trend, volume has been increasing, while the rejection and pullback saw decreasing volume, confirming the upward movement.
New entries make sense after breaking 0.8228, but require increased volume and momentum.
Place a stop-loss at 0.5375 , Targets are 1.2873 and 2.0136.
📝 Final Thoughts
Stay calm, trade wisely, and let's capture the market's best opportunities!
This analysis reflects our opinions and is not financial advice.
Share your thoughts in the comments, and don’t forget to share this analysis with your friends! ❤️

AI/USDT Buy setup free signal from meYou can buy hand hold here on the support area BINANCE:AIUSDT.P

AIUSDTusing spranzo model of 123 as AIUSDT will finish 1 and 2 and prepared to go for 3 and break all other tops
its going bullish and lets see

#AI/USDT #AI
The price is moving in a descending channel on a 30-minute frame and is expected to continue upwards
We have a trend to stabilize above the moving average 100 again
We have a descending trend on the RSI indicator that supports the rise by breaking it upwards
We have a support area at the lower limit of the channel at a price of 0.7000
Entry price 0.7130
First target 0.7355
Second target 0.7642
Third target 0.8000


AI seems to be very strong, even why BTC is making a correction, regarding the Artificial Intelligence, if this trend of AI will remain strong as it seems to be, then the next 8 hours, if BTC will hold this levels ALTS will go pumpy

Prepare to BUY Spot AIUSDT This WeekPrepare to BUY Spot AIUSDT This Week
🌟 Short-Term Opportunity with AIUSDT! 🌟
🌍 Market Overview:
AIUSDT is showing strong potential for gains this week. Using RainBow MG3, you can set up precise BUY signals on the H4 timeframe for optimal entry.
📊 Trade Plan:
📌 Entry Point: $0.7 - $0.78 – Accumulate within this range based on indicator signals.
🎯 Target: +30% – Aiming for a solid return within the week.
⏳ Hold Time: Until the end of this week – Strategically aligned with the H4 cycle.
🔍 Strategy Insights:
H4 Momentum with RainBow MG3:
Use the indicator to confirm BUY signals and ensure precision in entry.
Short-Term Focus:
Designed to capitalize on quick upward moves within the week.
💡 Note: This is not financial advice. Always DYOR before trading.
🔥 AIUSDT is set for a strong move – Position yourself now! 🔥

AI/USDTKey Level Zone : 0.7200-0.73500
HMT v3.1 detected. The setup looks promising, supported by a previous upward/downward trend with increasing volume and momentum, presenting an excellent reward-to-risk opportunity.
HMT (High Momentum Trending):
HMT is based on trend, momentum, volume, and market structure across multiple timeframes. It highlights setups with strong potential for upward movement and higher rewards.
Whenever I spot a signal for my own trading, I’ll share it. Please note that conducting a comprehensive analysis on a single timeframe chart can be quite challenging and sometimes confusing. I appreciate your understanding of the effort involved.
Important Note :
Role of Key Levels:
- These zones are critical for analyzing price trends. If the key level zone holds, the price may continue trending in the expected direction. However, momentum may increase or decrease based on subsequent patterns.
- Breakouts: If the key level zone breaks, it signals a stop-out. For reversal traders, this presents an opportunity to consider switching direction, as the price often retests these zones, which may act as strong support-turned-resistance (or vice versa).
My Trading Rules
Risk Management
- Maximum risk per trade: 2.5%.
- Leverage: 5x.
Exit Strategy
Profit-Taking:
- Sell at least 70% on the 3rd wave up (LTF Wave 5).
- Typically, sell 50% during a high-volume spike.
- Adjust stop-loss to breakeven once the trade achieves a 1.5:1 reward-to-risk ratio.
- If the market shows signs of losing momentum or divergence, ill will exit at breakeven.
The market is highly dynamic and constantly changing. HMT signals and target profit (TP) levels are based on the current price and movement, but market conditions can shift instantly, so it is crucial to remain adaptable and follow the market's movement.
If you find this signal/analysis meaningful, kindly like and share it.
Thank you for your support~
Sharing this with love!
HMT v2.0:
- Major update to the Momentum indicator
- Reduced false signals from inaccurate momentum detection
- New screener with improved accuracy and fewer signals
HMT v3.0:
- Added liquidity factor to enhance trend continuation
- Improved potential for momentum-based plays
- Increased winning probability by reducing entries during peaks
HMT v3.1:
- Enhanced entry confirmation for improved reward-to-risk ratios

AI massiveAfter our buy print AI is looking stronger and stronger with another buy Print. That big elephant candle prior to first buy is guiding the mooner after a good volume
Next stop would be 0.85
DYOR
For early entry, use our indicator. You can drop a message to know more

