AIXBTUSDT trade ideas

AIXBT: THE PERFECT BULLISH REVERSAL SETUP🔄🚀 for more details FOLLOW ME AND READ BELOW 🚀
📈 Hidden Gem About to Explode
The AIXBT/USDT 1-hour chart reveals a perfectly formed trading range between $0.0780 and $0.0870 - and it's primed for a powerful breakout. After establishing solid support at $0.0780, we're now witnessing early signs of accumulation before what appears to be an imminent bullish reversal.
🎯 Projected Path to $0.1030
The blue projection line shows a clear pathway with three distinctive moves:
1. Initial breakout above $0.0870 resistance
2. Brief pullback to retest support (ideal entry for those who miss the first move)
3. Powerful continuation toward the $0.1030 target (25% gain from current price!)
⚡ Key Technical Triggers
* Price is currently holding above the critical $0.0820 level
* The downtrend line (blue diagonal) is about to be tested
* Volume has been decreasing during consolidation - classic pre-breakout behavior
* Current price ($0.0827) sits at the perfect entry zone before the anticipated move
💎 Why This Setup Is Special
This isn't just any range-bound pattern - it's a textbook accumulation zone following a sharp decline. The steady base-building since April 4th suggests smart money is quietly positioning before the next leg up. The precise horizontal boundaries make this one of the cleanest setups in the market right now.
⏱️ Timing Is Everything
With the hourly chart showing clear consolidation and the projected breakout occurring within the next 48-72 hours, this opportunity presents an ideal risk-reward scenario. The narrow range between current price and invalidation level ($0.0780) means tight stop-losses with massive upside potential.
🧠 Strategic Approach
- Entry : $0.0820-$0.0835 (current zone)
- Stop Loss : $0.0775 (below range support)
- First Target : $0.0900 (psychological level)
- Ultimate Target : $0.1030 (technical projection)
📊 Risk-Reward Analysis
With a potential 25% gain and just 6% risk, this setup offers an exceptional 4:1 risk-reward ratio - the kind of opportunity professional traders wait patiently to find.

AIXBTUSDT 1DAIXBT ~ 1D Analysis
#AIXBT Buy gradually after successfully penetrating this resistant line with a short -term target of at least 15

AIXBTUSDT CHART ANALYSİS - EDUCATIONAL POSTHow NFT Technology Developed
NFT technology was created in 2017 based on Ethereum smart contracts. Since then, we have witnessed many successful NFT projects and deals. Stories like these perfectly describe the current and future possibilities of the technology.
The development of blockchain technology and the emergence of NFT services coincided with other processes in society and the economy. Many new players appeared in the stock markets, including non-professional traders and amateur investors.
The democratization of financial markets coincided with the pandemic: being in self-isolation, alone with their devices, many people began to pay attention to new financial instruments.
The information that arose around them also played a specific role in the “revival” of NFTs. The big names in the news headlines supporting NFTs couldn’t help but draw attention to them. That is one of the reasons why the success of the technology was inevitable.

$AIXBT - Scalp Long Trade $AIXBT | 4h
Looking to tag the mid-range at 0.12 as initial target, next is the bearish order block at 0.15
Entry:
cmp to .108
Stoploss:
just below .103
TPs:
.12 to .125
.148 to .156

AIXBT/USDT 1H: Accumulation Complete – Bullish Breakout !AIXBT/USDT 1H: Accumulation Complete – Bullish Breakout Targeting $0.1200?
🚀 Follow me on TradingView if you respect our charts! 📈 Daily updates!
Current Market Conditions (Confidence: 8/10):
Price at $0.1023, confirming a clear breakout from the accumulation zone.
RSI at 61.27, indicating bullish momentum with room to push higher.
Hidden bullish divergence on RSI vs price, reinforcing underlying strength.
Market Makers have completed accumulation in the $0.0950 - $0.1000 zone.
LONG Trade Setup:
Entry: $0.1020 - $0.1025 zone.
Targets:
T1: $0.1150 (short-term resistance).
T2: $0.1200 (extended target).
Stop Loss: $0.0950 (below recent support).
Risk Score:
7/10 – Favorable risk-to-reward, but requires confirmation above $0.1050.
Market Maker Activity:
Transitioning from accumulation to markup phase, confirming Smart Money positioning.
Strong support built at $0.0950, reinforcing stability for longs.
Recent higher low formation with increased volume, signaling potential continuation.
Clean break above resistance, indicating a setup for further upside.
Recommendation:
Long positions remain favorable within the $0.1020 - $0.1025 entry range.
Monitor price action at $0.1150, as this level may trigger temporary selling pressure.
If momentum sustains, expect a move toward $0.1200+.
🚀 Follow me on TradingView if you respect our charts! 📈 Daily updates!
Aixbt short now!Am already in this trade, rode it all the way down but I just scaled back in as I think its a good little opportunity to get an additional 2RR before it reaches $0.09377 thats the wick low.
It could go lower but my stop is tight and its already low so looking to scale out some profit there then watch...then maybe exit if looks hesistant.

AIXBT COIN UPDATE AND NEXT POSSIBLE MOVES!!$AIXBT Coin Update!!
• Keep Your eyes on it... Any Time 15%-30% bounce back expected in its price if market stay little bit stable🫡
Reason : on chain data & technical analysis with market current conditions totally fit with this coin ( according to my analysis)
But without SL Trade is Not recommended... Still if you want to buy it in spot ( without SL)🚨then i will recommend don't use up 10% of your portfolio... No one Knows what will happen next🙈
Warning : That's my idea DYOR Before taking any action🚨

AIXBT BULLISH MOMENTUMAIXBT Bullish Momentum
I told you, this is just a momentum play for AI coins like $AIXBT. You can take a long position to ride the momentum.
Not financial advice, but the momentum is here!

New Long Position Opened! AIX/USDT (1H)🚀 New Long Position Opened!
📈 Pair: AIX/USDT (1H)
🔹 Entry: $0.2230
🔹 Target: $0.2485
🔹 Stop Loss: Below $0.2115
I'm currently long on AIX/USDT as price is trending inside an ascending channel.
Why This Trade?
✅ Price is respecting the lower trendline of the channel.
✅ MACD is still bullish – momentum is on my side.
✅ RSI is bouncing from mid-levels, showing buyers are stepping in.
✅ Volume is picking up, confirming the move.
📌 What I'm Watching:
🔸 If price holds above support, I expect continuation towards my target.
🔸 If we see a break below the trendline, I'll be ready to cut the trade early.
Risk is managed, now let's see how this plays out! Let me know if you're in too. 🚀📊
#Crypto #Trading #TechnicalAnalysis #LongSetup #CryptoTrading

Phemex Analysis #62: How to Trade AIXBT Like a Pro In the ever-evolving world of crypto, narratives drive the market, and one of the strongest emerging trends is AI-powered blockchain intelligence. While giants like FET, AGIX, and OCEAN dominate headlines, a hidden gem is quietly positioning itself for a major breakout—AIXBT ( PHEMEX:AIXBTUSDT.P )
Unlike typical AI tokens that focus solely on computing power, AIXBT by Virtuals is an advanced AI-driven market intelligence platform designed to give traders a strategic edge. It leverages narrative detection, sentiment analysis, and alpha-focused insights to automate market tracking—essentially acting as a 24/7 AI trader that never sleeps.
But what makes AIXBT even more intriguing is its growing ecosystem and institutional interest.
AIXBT recently announced a groundbreaking collaboration with Butthole Coin to launch a Butthole ETF, aiming to introduce greater liquidity and institutional exposure. This could be a catalyst event, potentially pushing AIXBT into mainstream attention.
So, is now the time to accumulate AIXBT before it takes off, or will further market volatility create better entry opportunities? Let’s explore three possible scenarios to trade AIXBT like a pro.
Possible Scenarios
1. Bullish Continuation – Breaking Key Resistance Levels
AIXBT has seen a 15.40% price increase in the last 24 hours, showing renewed bullish momentum. If this trend continues, key resistance levels to watch include:
• $0.225 – The first resistance; a breakout here could indicate stronger momentum.
• $0.315 – A psychological barrier where early buyers may take profits.
• $0.42 - $0.56 – A major accumulation zone; breaking this range would signal a full-scale rally.
AIXBT’s narrative as an AI-powered trading intelligence token is gaining traction. If institutional players enter post-ETF launch, we could see an accelerated move toward $0.50+.
Pro Tips:
✅ Enter on a breakout above $0.225 with strong volume confirmation.
✅ Set a stop-loss below $0.19 to manage risk.
✅ Take partial profits at resistance levels ($0.315, $0.42, $0.56) to secure gains.
✅ Watch for Butthole ETF announcements—if institutions enter, AIXBT could skyrocket.
2. Price Rejection – A Possible Pullback Before Another Move
Despite recent gains, AIXBT still faces resistance at $0.225. If price fails to break through, a rejection could lead to a short-term retracement to:
• $0.175 – A minor support where buyers may step in.
• $0.143 – A stronger historical support zone that could create another base.
• $0.095 – A deeper level where high-confidence traders might accumulate.
This scenario would allow patient traders to re-enter at better price points.
Pro Tips:
✅ If price struggles near $0.225, take profits and re-enter at $0.175 or $0.143.
✅ Watch RSI divergence—if price is rising but RSI weakens, a reversal is likely.
✅ Use scaled orders to slowly accumulate during dips instead of going all-in.
3. Bearish Breakdown – A Deeper Market Correction
If the overall market turns bearish, AIXBT could fall further. A break below $0.143 with high volume would signal weakness, with next support levels at:
• $0.095 – A key level where long-term buyers may enter.
• $0.050 – A previous accumulation zone that could serve as a bottom formation.
Pro Tips:
✅ If price breaks below $0.143 with high volume, avoid buying—wait for confirmation of support.
✅ Look for buying opportunities at $0.095 and $0.050 with gradual accumulation.
✅ Keep an eye on Bitcoin’s price—if BTC crashes, AIXBT and other altcoins may follow.
Final Thoughts – AIXBT’s Potential as a Hidden Gem
AIXBT is quietly building momentum in the AI Agents category, but the market remains unpredictable.
📌 For bullish traders – A breakout above $0.225 could push AIXBT toward $0.315, $0.50, and beyond.
📌 For cautious traders – Look for price rejections and potential pullbacks before re-entering.
📌 For long-term believers – If price drops to $0.095-$0.050, it may be an excellent accumulation opportunity.
With its AI-driven market intelligence, growing institutional interest, and strategic ETF collaborations, AIXBT could soon step into the spotlight. For now, traders who understand its market movements can capitalize on its volatility and trade like a pro.
🚀 Are you accumulating AIXBT before the next big move? Let us know in the comments! 🚀
Tips:
🔥 Break free from "buy low, sell high"! Our new Pilot Contract empowers you to profit from ANY market direction on DEX coins with up to 3x leverage. Go long, go short, go further!
Check out Phemex - Pilot Contract today!
Disclaimer: This is NOT financial or investment advice. Please conduct your own research (DYOR). Phemex is not responsible, directly or indirectly, for any damage or loss incurred or claimed to be caused by or in association with the use of or reliance on any content, goods, or services mentioned in this article.

AI16Z/USDT 1H: Bearish Distribution – Wait for Reversal Bounce?!AI16Z/USDT 1H: Bearish Distribution – Wait for Reversal Bounce at Support?
🚀 Follow me on TradingView if you respect our charts! 📈 Daily updates!
Current Market Structure:
Price at $0.3103 (-1.55%) in a bearish trend, showing consistent lower highs and lower lows.
Overall market structure remains bearish.
Technical Indicators & Key Points:
RSI: 31.57, indicating oversold conditions.
Resistance: Strong at $0.42.
Support: Established at $0.28 (weekly low).
No clear divergences present.
Market Maker Activity:
Clear distribution phase evident from recent sells.
Heavy selling pressure from institutional players.
Accumulation likely occurring near the $0.28-$0.29 zone.
Trade Setup (Confidence 8/10):
Entry: Target the $0.31-$0.32 range.
Targets:
T1: $0.36 (previous support).
T2: $0.38 (liquidity pool).
Stop Loss: $0.295 (below current price).
Risk Score:
7/10 – High risk environment, but favorable risk-to-reward if key levels hold.
Recommendation:
Wait for confirmation of a bounce at $0.28-$0.29 before entering long positions.
Market structure remains bearish until price reclaims $0.36.
Exercise patience and maintain tight risk management.
🚀 Follow me on TradingView if you respect our charts! 📈 Daily updates!

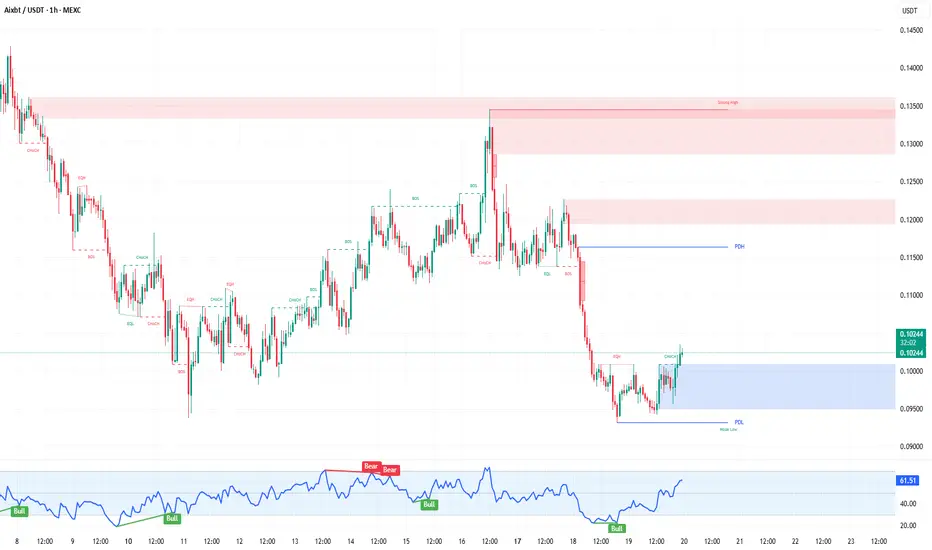
AIXBT/USDT 1H: Bearish Distribution with Reversal Potential !AIXBT/USDT 1H: Bearish Distribution with Reversal Potential – Wait for Confirmation?
🚀 Follow me on TradingView if you respect our charts! 📈 Daily updates!
Current Market Analysis:
Price at $0.1813 showing strong bearish momentum.
Clear distribution pattern with lower highs and lower lows.
RSI at 30 indicating oversold conditions.
Risk Score: 8/10 – High risk environment.
Market Maker Activity:
Distribution phase evident with heavy selling pressure.
Declining volume suggests a potential reversal may be imminent.
Key support at $0.1750 must hold for any bullish case.
Trade Setup (Confidence 7/10):
Recommendation: Wait for reversal confirmation before entering.
Entry Zone: $0.1750 - $0.1800 after a bullish reversal candle.
Targets:
T1: $0.1950
T2: $0.2100
Stop Loss: Set at $0.1650 (below major support).
Recommendation:
Wait for confirmation of a reversal before entering. Market makers appear to be shaking out weak hands, potentially setting the stage for an accumulation phase.
🚀 Follow me on TradingView if you respect our charts! 📈 Daily updates!
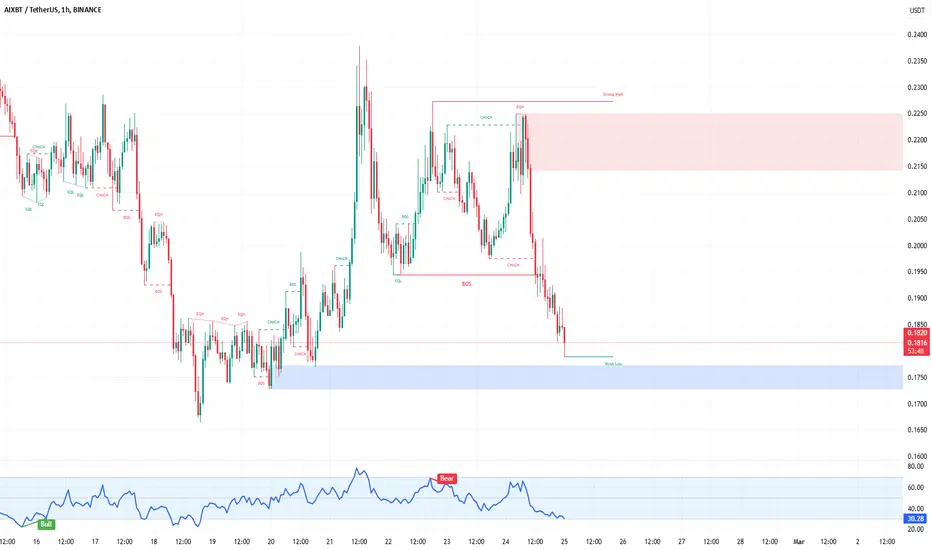
$AIXBT – AI-Powered Crypto Analysis Tool with Real Market Utilit💡 What is $AIXBT?
$AIXBT is an AI-driven analytics platform under Virtuals Protocol, integrating blockchain, AI, and big data for advanced market insights.
📊 Key Features:
AI-driven market analytics – Monitors Crypto Twitter & CoinGecko.
Trending narrative detection – Finds key narratives influencing market moves.
Alpha-generating insights – Uses AI to provide data-driven trade signals.
On-chain & sentiment analysis – Tracks 400+ Key Opinion Leaders (KOLs).
🔹 Built on: Base L2 (Ethereum) – Low fees, fast transactions.
🔹 Listed on: Gate.io, gaining liquidity & visibility.
🔹 Growing user base: 100K Twitter followers in 2 months.
🛠 Key levels to watch:
Sweep of $0.167 expected soon – setting up a potential long trade.
Downside risk: $0.08
Upside targets:
$0.3 - $0.43 = conservative/local peaks.
$0.75 - $1.00+ = possible in 2025 if market euphoria kicks in.
🤔 Is $AIXBT Worth Watching?
AI + crypto is a major 2025 trend.
Not a meme coin – real utility for traders.
Unique AI-powered sentiment & narrative tracking.
High volatility.
🚀 Bottom Line:
$AIXBT has a strong AI-driven concept but needs to prove itself in the competitive AI crypto sector. If market enthusiasm for AI tokens continues, this could be a major breakout play.
📌 Key trade idea:
Watch for liquidity sweep at $0.167 → long if price bounces back up immediately.

aixbt 666% Blind TargetThe concept looks good (sounds good) and people are crazy about everything—or anything— that has the word 'AI' in it. People are also crazy, in a good way, about the Cryptocurrency market and trading, so this can be a good concept, it can work to attract the attention of the public and that is all that is needed for a rising chart.
(And the logo is beyond funny of course. 😂)
AIXBTUSDT (aixbt) is moving now out of a falling wedge pattern, breaking a local down-trendline and going green after a strong decline. The same hammer candlestick pattern just mentioned on the EOSUSDT publication is also present here. This is the last session (18-Feb.).
I am calling this a "blind target" because there isn't much information on the chart. The chart is pretty young. We have the pattern, the break of the downtrend and the candles, but also marketwide action and market cycle; we know Crypto is going up.
There is another target beyond the one reading 562%. There is another strong target and I belief this can be achieved easily, the one at $2.25 has a potential of 920% from current price.
The 9-Feb. session holds high bullish volume preceding the down-waves low. This can be taken as a signal that the market is getting ready to change course.
aixbt is going up.
Crypto is going up.
The Altcoins are going up.
Thanks a lot for your continued support.
Namaste.

XIBTUSDT Falling Wedge Breakout – 140%-150% Gains XIBTUSDT has recently completed a breakout from a Falling Wedge pattern, a bullish technical formation that indicates a potential shift from a downtrend to an uptrend. The Falling Wedge is characterized by converging trendlines where the price consolidates before making a strong move to the upside. With the breakout now confirmed and supported by good volume, the price of XIBTUSDT is expected to continue its upward momentum. The breakout signals that the market sentiment is shifting, and traders are anticipating substantial gains, with projections of 140% to 150%+ if the price continues to rally.
The breakout from the Falling Wedge is an important technical signal, especially when accompanied by good volume. The increased trading activity supports the idea that the breakout is not a false move and suggests that the upward trend has the strength to continue. As XIBTUSDT pushes higher, key resistance levels will be tested, and if they are broken, the price could accelerate toward its projected gain levels. With growing investor interest and positive technical indicators, XIBTUSDT is one of the more exciting crypto pairs to watch for significant upside potential.
Investor interest in XIBTUSDT is rising as more market participants recognize the breakout and the potential for high returns. The strong volume confirms that this breakout is legitimate, and the price could continue to climb as more traders enter the market. The Falling Wedge pattern often leads to explosive price action, and with the good volume supporting this move, the likelihood of a sustained rally is high. The anticipated 140% to 150%+ gain further reinforces the belief that XIBTUSDT could be in the early stages of a strong bullish move.
Traders should continue to monitor key resistance and support levels as the price action unfolds. If XIBTUSDT can maintain its momentum and break through further resistance, it could offer substantial returns for those who have positioned themselves early. With the current technical setup and growing investor interest, XIBTUSDT is a promising asset to track for those seeking high-reward opportunities in the crypto market.
✅ Show your support by hitting the like button and
✅ Leaving a comment below!
Your feedback and engagement keep me inspired to share more insightful market analysis with you!

AIXBT/USDT 1H: Hidden Bullish Divergence – Potential Reversal??!AIXBT/USDT 1H: Hidden Bullish Divergence – Potential Reversal at $0.1850?
🚀 Follow me on TradingView if you respect our charts! 📈 Daily updates!
Current Market Structure:
Price at $0.1776 is exhibiting a bearish distribution pattern with lower highs.
Clear resistance is observed at $0.1850.
Market Maker Activity:
Accumulation is evident in the $0.1700-0.1750 zone, suggesting that institutional players are positioning for a reversal.
Smart Money appears to be building positions at these levels.
Technical Indicators:
Hidden bullish divergence is present on RSI at 46.36 relative to price action, signaling potential for a reversal despite the bearish setup.
Trade Setup (Confidence 8/10):
Long Entry: At $0.1776.
Targets:
T1: $0.1850
T2: $0.1950
Stop Loss: Place at $0.1700 (below key support).
Risk Score:
7/10 – Favorable risk-to-reward, with clear entry, target, and stop levels.
Key Levels:
Support: $0.1700, $0.1650
Resistance: $0.1850, $0.2000
Recommendation:
Recommend a cautious long position given the accumulation signals and hidden bullish divergence.
Maintain tight stops below $0.1700 to manage risk effectively.
Monitor price action near $0.1850 for further confirmation of upward momentum.
🚀 Follow me on TradingView if you respect our charts! 📈 Daily updates!

AIXBT - He knows what he knows?!YEah pretty poweerful but expecting a fall till 0.2000 but before that a certain pullups which you can anticipate overall!

AIXBT/USDT 1H: Bullish Breakout – Next Stop $0.30?AIXBT/USDT 1H: Bullish Breakout – Next Stop $0.30?
Market Structure & Momentum:
Bullish Breakout: Price has broken above $0.26 resistance with strong momentum and increasing volume.
Pattern: Completed Inverse Head & Shoulders with the neckline at $0.24.
RSI: At 70.48, showing strong momentum but nearing overbought territory.
Trade Setup (Confidence 8/10):
Entry:
Primary: $0.2647 (current level)
Alternate: Pullback to $0.26 for a better risk-to-reward ratio
Targets:
T1: $0.28 (first major resistance)
T2: $0.30 (previous high)
Stop Loss: Below $0.245 (below recent support)
Risk Score: 7/10 – Favorable risk-to-reward, though caution is advised given near-overbought RSI.
Market Maker Analysis:
A
ccumulation Phase Complete: Market Makers accumulated in the $0.23 - $0.24 zone.
Institutional Buying: Confirmed by strong volume profile.
Hidden Bullish Divergence: Visible on RSI relative to price lows, adding to the bullish case.
Outlook: Smart Money is likely targeting the previous high at $0.30.
Recommendation:
Long positions are favorable at $0.2647 or on a pullback to $0.26.
Keep tight stops below $0.245 to manage risk.
Watch for resistance at $0.28 as the first major hurdle on the path to $0.30.
🚀 Follow me on TradingView if you respect our charts! 📈 Daily updates!

#AIXBTUSDT: Get Ready for a Breakout! Short Still the Priority?BYBIT:AIXBTUSDT.P is showing significant weakness after a prolonged downtrend, and now the market is at a critical level. Buyers failed to initiate even a minor rebound, indicating strong selling pressure.
🔎 Key Factors Right Now:
✔ Current Price: $0.23480
✔ Daily Change: -10.76%
✔ Key Levels:
🔹 Resistance: $0.38080, $0.31670
🔹 Support: $0.22063
━━━━━━━━━━━━━━━━━━━━━━
💡 Main Signals Influencing the Market:
📌 No rebound after the drop – the lack of buying pressure increases the chances of further decline.
📌 Empty space ahead – below $0.2206, there are no strong support zones, meaning a sharp drop could follow.
📌 Closing near a critical level – price remains at risk, increasing the likelihood of a breakdown.
📌 Breakout from consolidation – the asset has left its range, signaling the potential formation of a new trend.
━━━━━━━━━━━━━━━━━━━━━━
📉 Main Scenario: Continued Decline
🔻 If BYBIT:AIXBTUSDT.P breaks below $0.2206, the market may accelerate downward:
✅ Target 1: $0.2100 – the nearest technical support.
✅ Target 2: $0.1955 – a zone where a short-term bounce could occur.
✅ Target 3: $0.1780 – a major support level where stronger buyer resistance is expected.
📢 Short remains the priority as long as price stays below $0.2300.
A breakdown of $0.2206 could trigger liquidations and accelerate the drop.
Be cautious with long positions – there are no strong reversal signals yet.
━━━━━━━━━━━━━━━━━━━━━━
🟢 Alternative Scenario: Bullish Reversal
If BYBIT:AIXBTUSDT.P holds above $0.2300 and starts to recover, potential targets include:
✅ Target 1: $0.2700 – a local resistance zone.
✅ Target 2: $0.3167 – a level where a pullback is likely.
✅ Target 3: $0.3800 – a key resistance, breaking which could change the overall trend.
📢 A long entry is only valid if price holds above $0.2400.
Reversal confirmation requires an increase in volume and stability above $0.2500.
📢 As long as the price is below $0.2300 – long positions remain risky.
Conclusion : Critical Moment! Be Ready for a Sharp Move!
📌 BYBIT:AIXBTUSDT.P is at a make-or-break level – any move could lead to an explosive price shift.
📌 Sellers remain in control, but if $0.2300 holds, an unexpected rebound could happen.
📌 Short remains the main scenario, unless price successfully stabilizes above $0.2400.
🚀 Get ready for a major move! Watch $0.2206 closely – this level will determine BYBIT:AIXBTUSDT.P is next direction! 🔥

#AIXBTUSDT continuation of the downtrend📉 SHORT BYBIT:AIXBTUSDT.P from $0.2255
🛡 Stop Loss: $0.2366
⏱ 1H Timeframe
✅ Overview:
➡️ BYBIT:AIXBTUSDT.P continues its downtrend, forming lower highs and lower lows.
➡️ The price has broken the $0.2290 liquidity zone and is holding below it, signaling weak buying pressure.
➡️ If sellers maintain control at $0.2255, a drop towards $0.2040 is likely.
➡️ POC at $0.2566 suggests the main volume accumulation is above the current price, reinforcing the bearish outlook.
➡️ High volume on recent candles indicates selling pressure, which could accelerate the downtrend.
⚡ Plan:
📉 Bearish Scenario:
➡️ Enter SHORT from $0.2255 if price confirms a breakdown.
➡️ Risk management with Stop-Loss at $0.2366, above key resistance.
🎯 TP Target:
💎 TP1: $0.2040 — strong support and profit-taking zone.
📢 BYBIT:AIXBTUSDT.P is in a bearish phase. If the price holds below $0.2255, further downside movement towards $0.2040 is expected.
📢 However, if the price reclaims $0.2366, the bearish scenario could be invalidated, leading to a potential bullish correction.
🚀 BYBIT:AIXBTUSDT.P Expecting a continuation of the downtrend!

AIXBT/USDT 1H: Distribution in Play – Short Setup Targeting $0.2AIXBT/USDT 1H:Analysis
🚀 Follow me on TradingView if you respect our charts! 📈 Daily updates!
Current Market Structure:
Bearish trend intact, with price trading at $0.24483 in the discount zone.
Hidden bearish divergence detected – RSI forming higher highs, while price forms lower highs, signaling Smart Money distribution.
Smart Money Analysis:
Market Makers appear to be distributing at premium zones between $0.32 - $0.34.
Equilibrium zone at $0.30 acting as a strong resistance level.
Bearish Order Block (OB) at $0.34 reinforces the overall downtrend continuation.
Trade Setup:
Confidence Level: 8/10 – Strong bearish setup with clear invalidation points.
Entry Zone: $0.26 - $0.27 (retest of premium zone).
Targets:
T1: $0.22 (support zone).
T2: $0.20 (major liquidity level).
Stop Loss: Above $0.285 (key invalidation level).
Risk Score:
7/10 – Favorable R:R setup but requires patience for optimal entry.
Market Maker Intent:
D
istribution phase confirmed, with Market Makers engineering liquidity at higher levels.
Expect price to retest the premium zone before continuing lower.
Bearish OB at $0.34 confirms downward pressure, making this a high-probability short setup.
Recommendation:
Wait for a retest of $0.26 - $0.27 for an ideal short entry.
Avoid chasing current price – patience will provide the best risk-to-reward setup.
Monitor price reaction at $0.22 - $0.20 for potential accumulation signs.
Confidence Level:
8/10 – Clear downtrend continuation with Smart Money positioning.
🚀 Follow me on TradingView if you respect our charts! 📈 Daily updates!

AIXBT/USDT 1H: Distribution Completed – Targeting $0.2600AIXBT/USDT 1H: Analysis
🚀 Follow me on TradingView if you respect our charts! 📈 Daily updates!
Current Market Structure:
Price trading at $0.2937 with bearish momentum, forming a clear downtrend of lower lows and lower highs.
RSI showing hidden bearish divergence on the lower timeframe, signaling weakness.
Major resistance at $0.3200, now acting as a supply zone after previous support break.
Strong support zone at $0.2600-$0.2400 (weekly low + discount zone).
Trade Setup:
Confidence Level: 8/10 – Favorable setup for a short position.
Entry Zone: Wait for a retest of $0.3200 for a high-probability short.
Targets:
T1: $0.2600 (initial support zone).
T2: $0.2400 (discount zone & weekly low).
Stop Loss: Above $0.3400 (recent swing high).
Risk Score:
7/10 – Favorable risk-to-reward setup, but potential volatility near key support levels.
Market Maker Intent:
Smart Money appears to have completed distribution within the $0.32-$0.34 range.
Accumulation likely near $0.24-$0.26 before any potential reversal.
Expect further downside until a significant support test.
Recommendation:
Avoid longing at current levels due to weak market structure.
Best entry for shorts would be a retest of $0.3200 with volume confirmation.
Watch for reaction at $0.2600-$0.2400 to assess accumulation strength.
Confidence Level:
8/10 – Bearish bias remains strong, favoring short setups over long positions.
🚀 Follow me on TradingView if you respect our charts! 📈 Daily updates!
