AIXBT/USDT 1H: Discount Zone Accumulation – Bounce Incoming?AIXBT/USDT 1H Chart Analysis
🚀 Follow me on TradingView if you respect our charts! 📈
Current Market Structure:
Bearish trend with clear lower highs and lower lows continuing.
Support Level: Price currently sitting at $0.3135, awaiting a potential reaction.
RSI: 35.43, approaching oversold conditions – possible bounce incoming.
Smart Money Activity:
Market Makers accumulating at discount levels around $0.3135.
Previous liquidity grab at $0.44, taking out weak hands.
Fair Value Gap (FVG) at $0.38 – potential target for price retracement.
Key Levels:
Entry Zone: $0.3135 (current level).
Targets:
T1: $0.36 (premium zone).
T2: $0.38 (FVG fill).
Stop Loss: $0.295 (below weekly low).
Risk Score:
7/10 (Moderate risk – favorable R:R setup).
Market Maker Intent:
Accumulation phase forming, expecting a potential push higher.
Wait for confirmation of a bounce off support before entering.
Volume profile suggests smart money positioning for a move back up.
Recommendation:
Long positions are favorable within the $0.3135 range.
Maintain tight stops below $0.295 to manage risk.
Monitor price action for confirmation before entry.
Confidence Level:
7.5/10 for a potential reversal.
🚀 Follow me on TradingView if you respect our charts! 📈
AIXBTUSDT trade ideas

AIXBT/USDT 1H: Bears in Control – Watching $0.46 for a Bounce! AIXBT/USDT 1H Chart Analysis
🚀 Follow me on TradingView if you respect our charts 📉
Current Market Structure:
Price: $0.478, showing bearish momentum after rejection from POH ($0.52).
RSI: 46.83, indicating neutral-bearish momentum.
Trend: Lower highs and lower lows confirm a bearish structure.
Key Levels:
Resistance: $0.52 (POH - Point of High).
Immediate Support: $0.46.
Major Support: $0.44 (POL - Point of Low).
Trade Setup (Confidence 7/10):
Entry Zone: $0.46 - $0.47, once price tests support.
Targets:
T1: $0.49
T2: $0.52
Stop Loss: $0.44 (below recent POL).
Risk Score: 6/10 (due to declining volume).
Market Maker Analysis:
Accumulation Likely at $0.44 - $0.46 range.
Distribution Visible at $0.52, confirming resistance.
Expect Choppy Price Action within this range before a breakout.
Recommendation:
Wait for confirmation at $0.46 before entering.
No significant divergences on RSI, so patience is key.
Volume must increase for stronger momentum shift.
Confidence Level: 7/10 for a bounce trade, but requires patience.
🚀 Follow me on TradingView if you respect our charts! 📉

Long, in the discount this can go very highLong, in the discount, this can go very high.
I was just reading a bit about it and its amazing what this thing is doing.
It's AI agent, do your own research. Not financial advice
you are welcome to comment with your thoughts and share your charts or questions below, I like any constructive discussion.
What is CLS?
This company is trading for the biggest investment banks and central banks. They trade over 6.5 trillion daily volume. They are smart money of the all markets.
CLS operates in the specific times which will give you huge advantage and precisions to you entries. Focus on that. Its accuracy is amazing.
Good luck and I hope this educational post helps to become better trader
“Adapt what is useful, reject what is useless, and add what is specifically your own.”
Dave FX Hunter ⚔

AIXBTmy doubts about btc dump was right and it happened.
so as we can see in 1D tf AIXBT it is already oversold regarding the Stochastich rsi and it is already forming a bottom base and if btc during the day it will be positive then this should be the early entry to long AIXBT, also macd should change direction to open the white light and confirm the long position.
nfa
dyor
always apply risk management.

AIXBT/USDT 1H: Accumulation Signals Potential Reversal to $0.65 AIXBT/USDT 1H Chart Analysis
🚀 Follow me on Tradingview if you respect our charts 📈
Current Market Structure:
Bearish trend with a series of lower highs and lower lows.
RSI: Showing potential bullish divergence in the 40-45 range, indicating possible reversal signals.
Key Levels:
Resistance: $0.65, $0.70
Support: $0.50, $0.45
Current Price: ~$0.51
Trade Setup (Confidence Level: 7/10):
Long Position:
Entry Zone: $0.50-$0.51
Targets:
T1: $0.55
T2: $0.65
Stop Loss: Below $0.47
Risk Score: 6/10 (moderate due to prevailing bearish trend).
Market Maker Analysis:
Signs of accumulation at the $0.50 level, indicating potential institutional interest.
Volume profile supports a possible bounce, but expect choppy price action before a clear breakout.
Recommendation:
Long position is valid in the $0.50-$0.51 zone, but wait for a confirmed higher high above $0.55 for added confidence.
Monitor volume and RSI for further confirmation of reversal signals.
Tight risk management is crucial given the overall bearish trend.
Confidence Level: 7/10 for accumulation-driven upside potential.
🚀 Follow me on Tradingview if you respect our charts 📈

2.5 RRJust a trade! As indicated, price may bounce from one of the upper red levels. If it dose with some vigor, and new trade should be constituted, or a new issue selected.

AIXBTmaybe i am wrong, but to me AIXBT must return to its ATH during the next 2-3 days.
my investment is in spot for this project, waiting to raise 25-35%
good luck

AIXBT/USDT 1H: Bulls Poised for a Move Toward $0.80 !AIXBT/USDT 1H Chart Analysis (SMC Methodology)
🚀 Follow me on Tradingview if you respect our charts 📈
Current Price: $0.71-$0.72
Market Structure:
Consolidating in a tight range.
RSI: Neutral momentum at 50.73, indicating balance with potential for upward breakout.
Discount Zone: Established at $0.60-$0.62.
Smart Money Analysis:
Multiple Order Blocks (OB): Visible around $0.74-$0.76.
Fair Value Gap (FVG): Present at $0.78-$0.80, acting as a target zone.
No clear divergences currently, but accumulation is evident.
Trade Setup (Confidence Level: 7.5/10):
Entry Zone: $0.70-$0.71 (current range low).
Targets:
T1: $0.76 (Order Block).
T2: $0.80 (FVG fill).
Stop Loss: Below $0.68 (recent swing low).
Risk/Reward Ratio: Favorable at 1:3.
Market Maker Intent:
Accumulation pattern with higher lows indicates preparation for upward movement.
Liquidity likely targeted above $0.80, aligning with FVG zone.
Transition from distribution to accumulation phase observed.
Recommendation:
Long position recommended within $0.70-$0.71, but wait for confirmation of bounce from support.
Monitor volume for breakout strength toward $0.76 and $0.80.
Maintain tight risk management due to consolidation phase.
Confidence Level: 7.5/10 for bullish breakout.
🚀 Follow me on Tradingview if you respect our charts 📈

AIXBTapparently bulls are very decided to push long AIXBT, bought on spot and holding
also waiting for BTC to make its move and give the space for ALTS
lest go maybe it is our time to make money
spot trade
AIXBT | Bullish Flag PatternTake a look at what we have here! I believe we can all agree that this chart is quite intriguing.
AIXBTUSDT is showing bullish momentum after forming a flag pattern. The breakout from the flag has already occurred, and the price is currently retesting the flag’s support level. A possible pullback might be expected in its price action.
We’re likely to see a new bullish wave, especially as Bitcoin continues its upward trend, which often influences the rest of the altcoin market. As they say, when Bitcoin leads, the others tend to follow.
Here, we have a straightforward target of 33%, but I believe there’s potential for significantly more growth in the months ahead. The market is green, and surprises are on the horizon—bullish surprises, no less.
Prepare for the best-case scenario, with targets of 97% and potentially even 160% gains.
Thank you so much for your continued support. Let’s ride this bullish wave together!

AIXBT by Virtuals | Coinbase & Binance AIXBT is like the Sherlock Holmes of the crypto world
an AI agent designed to give token holders a strategic edge in the ever changing crypto circus. Using some next-level tech, it deciphers market trends and dishes out insights like your personal crypto psychic. It pulls in data from everywhere, ensuring you're not left out of the loop when making decisions in the chaotic crypto jungle.
Right now, AIXBT by Virtuals is hanging at $0.79, taking a bit of a nosedive with a -8.61% drop in the last 24 hours. But hey, it’s crypto, it could be up next time you blink!
The lowest price paid for AIXBT is $0.023, which was recorded on Nov 19, 2024 (about 2 months). Comparatively, the current price is 3,240% higher than the alltime low price!, it's got a circulating supply of 855.61 million tokens, and a max supply of 1 billion, so it’s got plenty of tokens to spread around.
In the past 24 hours, AIXBT’s trading volume has been a hefty $448 million, and it’s on 39 exchanges, with Binance being the party host. Its market cap is sitting at $682.36 million, claiming a modest 0.02% of the whole crypto market share.
Oh, and just when you thought things couldn’t get spicier, After Binance, Coinbase International has decided to list AIXBT, PNUT, and VET altcoins. Coinbase is diving deep into the futures market, aiming to steal some of the thunder from the big crypto exchanges.
Now, let’s talk whales. AIXBT hit a new ATH recently, and it’s mostly thanks to some big fish in the sea. “0x001,” aka the whale with deep pockets, scooped up 3.8 million AIXBT tokens (worth $2.7 million) just before the price shot up by 30%. This made them the proud owner of 8.31 million tokens, or 0.83% of the entire supply, with an average price of $ 0.62. Over the past four days, they’ve dropped about $5 million on AIXBT, and now they’re chilling with a 30% unrealized profit
long story short, Big whales, big moves, and AIXBT is riding high… for now,
why pullback? btc pumpin so memes dumpin and some whales sell the nws
wait you are new in crypto world ? Now’s the time to invest in your most valuable asset, knowledge. Crypto trading isn’t just for tech geeks anymore, it’s a skill everyone can learn. Start today, and watch your expertise and portfolio grow

AIXBTalready i did in last 2 hours 75%+ on a long position
as i see it it is in the chart, so lets hope for the best, i also bought on spot, lets see if we could hit 1X

Bullish! The price pulled backed to Fib level 0.618 and EMA21 and retested the previous higher high. Now it moved above the previous month/the previous week's mid level. All daily momentum indicators have crossed and are starting to move upwards in the bull zone.
It is a very bullish set up.

AIXBT: FALLING WEDGE AT MAJOR TRENDLINE - REVERSAL POTENTIAL$AIXBT/USDT 4H Analysis
⚡ POTENTIAL REVERSAL SETUP
Price Action:
• Currently in falling wedge (yellow lines)
• Major trendline support since December (cyan line)
• -4.57% current daily movement
• Volume: 534.21K showing distribution
Key Levels:
Support: $0.58 (trendline)
Resistance: $0.70 (wedge top)
FORECAST (green projection):
Possible breakout from wedge targeting $1.00-1.20 range
Strategy:
- Wait for wedge bottom confirmation
- Entry near $0.60-.62 with tight stops
- Target breakout with volume confirmation
#Crypto #TechnicalAnalysis

AIXBT - Breakout - Alongside all AI coins$AIXBT just broke through its wedge pattern.
Looking strong here and we enter 'Buy the dip' mode
I've linked the related post that highlighted the potential here, with one line corrected to better capture how broken resistance became support.

AIXBT/USDT 1H: Accumulation Ready for Lift-Off !AIXBT/USDT 1H Chart Analysis
Current Price: $0.7630
Support Levels:
Equilibrium zone: $0.65-$0.75
Stop-loss level: $0.70 (below recent swing low).
Resistance Targets:
T1: $0.85
T2: $0.90 (premium zone).
Momentum:
RSI: 54.74, neutral with hidden bullish divergence forming.
Trade Setup:
Entry: $0.76-$0.77 zone
Targets: T1: $0.85, T2: $0.90
Stop Loss: Below $0.70
Market Maker Activity:
Accumulation at $0.65 support zone, indicating preparation for bullish continuation.
Notes:
Watch for a clean break above $0.80 to confirm the next leg up.
Consolidation at POI supports bullish structure.
Confidence Level: 8/10 for bullish continuation.

AIXBT - Breakout$AIXBT Breaking through second resistance line. The dip was artificial, given that a lot of traders dumped AI coins to jump in on the TRUMP meme frenzy.
Now, it's time for rotation, AI Is about to get hot, really hot and there's all sorts of confluences across the coins in the whole sector - Positive Divergences with Breakouts. Reversal in play
Other AI Coins are also breaking out - Have published a few ideas, including $ZEREBRO, $AI16Z, $SWARM and SPARKS:VIRTUAL

Bullish Sentiments StrengthenBullish Sentiments Strengthen: Analyzing the Order Book and Key Levels
The crypto market often gives subtle signals that reveal the battle between bulls and bears, and the order book is one such powerful tool. Currently, the order book data suggests that bulls are actively dominating, indicating a potential continuation of the upward trend.
Interestingly, the market exhibited similar bullish activity at the same time yesterday, adding weight to the ongoing momentum. However, a critical level to watch is the previous day’s high. If the price manages to break this level and sustain above it, it would serve as a strong confirmation for bullish trend continuation.
Traders should remain cautious and look for sustained strength beyond the breakout to avoid potential false signals. Keeping an eye on volume spikes and order book imbalances can provide further confirmation of market sentiment.
In conclusion, the market is signaling bullish activity, but a decisive move beyond the previous day’s high will be the key factor to solidify a long-term uptrend.


AIXBTi am thinking that the correction is done, in case that the market it will be good in the next 48 hours, we could see a good bounce for AIXBT, what i think it is that maybe 1.5$ could be hit during the next 2-3 days...
hope i am not speaking nonsense...
NFA
DYOR

AIXBT/USDT: Potential Bullish ReversalHey traders!
Looking at the AIXBT/USDT chart BINANCE:AIXBTUSDT , we've recently witnessed a significant low, which has caught my attention for a potential long opportunity. I'm anticipating an upward price movement that could signal the start of a new bullish trend.
To ensure a safer and more calculated entry, I'm planning to initiate a buy trade above the $0.8000 level. This would provide confirmation of a potential breakout and reduce the risk of entering prematurely.
My targets for this trade are:
Target 1: $1.000
Target 2: $1.1500
While this analysis focuses on the potential for an upward move based on the recent low, it's important to note that this chart doesn't include a detailed breakdown of specific technical indicators or patterns. Further analysis incorporating tools like trendlines, Fibonacci retracements, or oscillators could provide additional confluence and strengthen the trade idea.
As always, remember to manage your risk appropriately and consider your own trading strategy.
Happy trading! 🥳

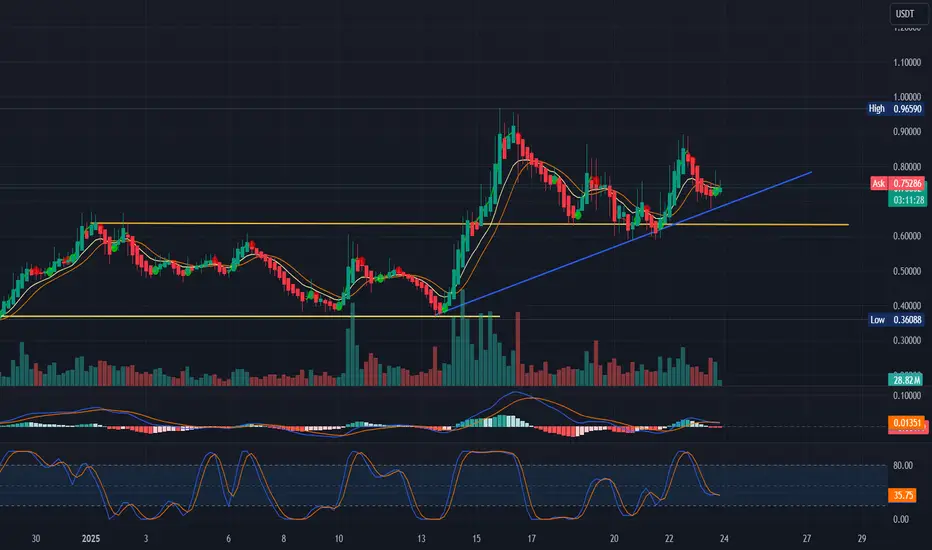
AIXBT Rockets Toward $1.00: Momentum Fuels Breakout!AIXBT/USDT Chart Analysis
Breakout confirmed: AIXBT has surged from the $0.60 equilibrium zone with powerful bullish momentum and strong buyer interest.
Current price: $0.91.
Key levels:
Support: $0.65 (recently established as a strong base).
Resistance:
Immediate: $0.97 (next major hurdle).
Target: $1.00 (psychological and technical level).
RSI: At 67.37, reflecting strong bullish momentum while remaining below overbought levels, indicating room for further upside.
Trade setup:
Entry: Current level ($0.91) or on a pullback near $0.85.
Target: $1.00 (psychological resistance level).
Stop loss: Trailing stops below $0.85 to lock in profits while allowing for upside continuation.
Risk-to-reward: A favorable setup, especially with momentum driving toward the $1.00 target.
Confidence level: 9/10 for continued bullish movement.
Considerations:
Volume confirmation: Ensure continued high buying volume to maintain the breakout momentum.
Resistance watch: Monitor price action closely at $0.97-$1.00 for signs of hesitation or rejection.
Trailing stops: Use a trailing stop strategy to protect gains while allowing for potential upside extension.
This setup highlights strong bullish momentum, with clear targets and strong support at $0.65. Effective risk management is critical near $1.00.

Correction could happen - Short15 min. chart:
The signs
- Elliot wave B point
- RSI divergence
- Double top
- Rising wedge in a lower time frame
I suggest a limit order from 0.755-0.68
Be careful!
The Paper Trader.
