ALGBTC trade ideas

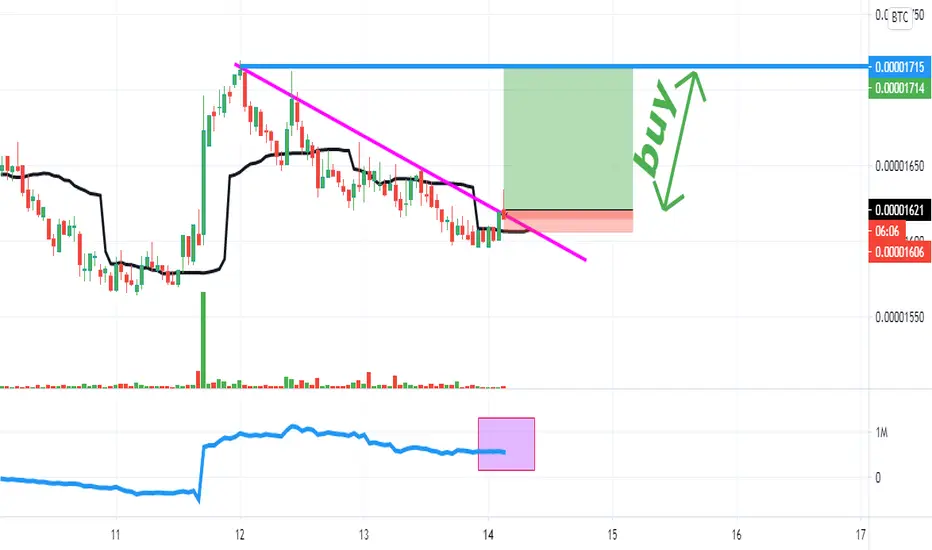
ALGO Trend line breakoutprice break the trend line buying small amount here with stop below support zone 0.00001380 sats


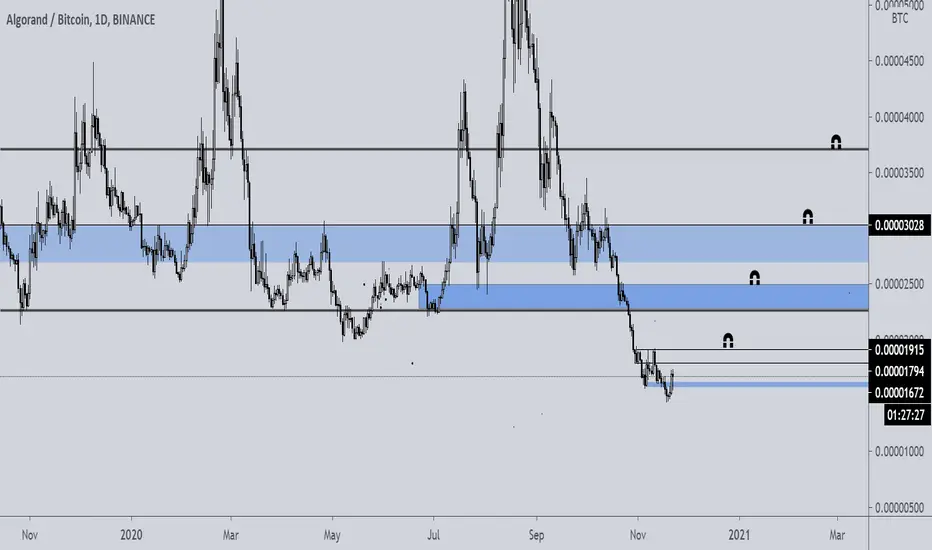
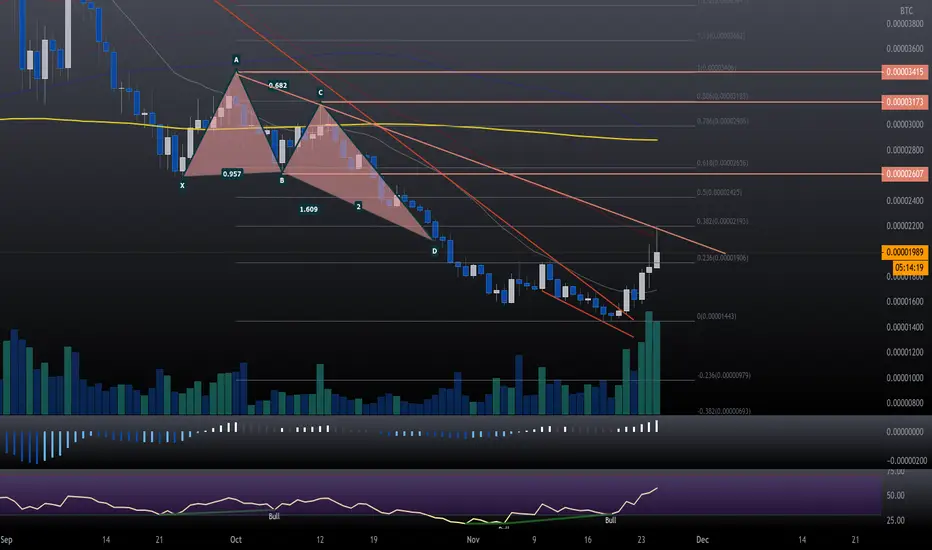
MY LEVELSthose are levels I watch, ideal target4000-3900 then re-evaluate,could be negated if BTC dumps stops are easy to set here as it is still close to recent swing low
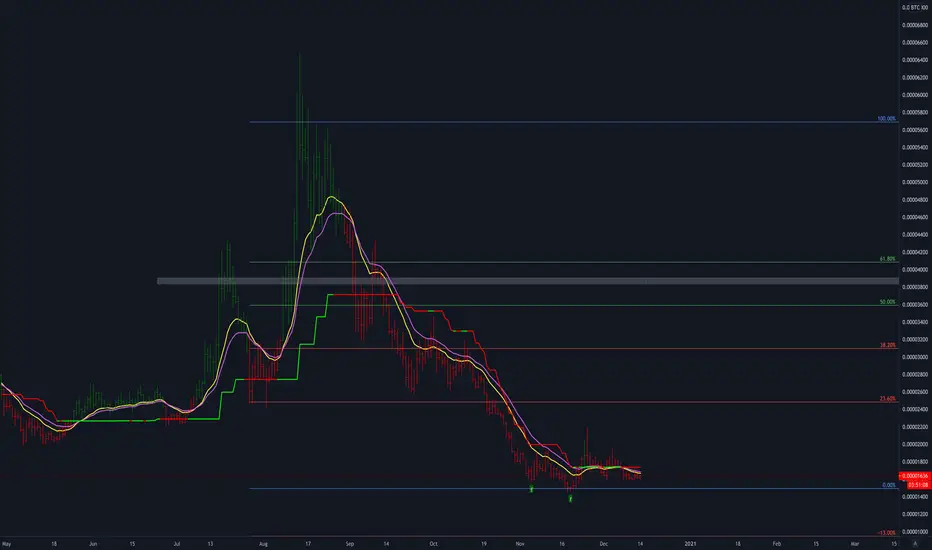

Curves Ahead ALGO/BTC #Algorand #Algo $ALGO #crypto #BitcoinHere we see our Algo Btc chart daily with that colorful Fib circle indicator on it . You can see that blue circle line we are in that's curving up ? With the blue arrows pointing up at it ? We should stay in that line and follow it up , within a month we should be inside that large Ichimoku cloud . The top of which is about 3600 to 3700 sats but can obviously go higher if it breaks through . 3700 is also roughly the top of the .618 Fib circle line and seems to be a target . Many alts are looking good here .

ALGO/BTCALGO/BTC
This market knows the birth of a new approach and the rising powers until I Resistance for this must purchase now
ALGOBTC IdeaHard to see, but I think we are at the bottom and this will pump (Similar to atom and xtz). Looking to take profit in the tan box sometime within the next few months. GL


algo/btc possible 150%this is not my analysis, this is from alanmasters ,but i wanna publish it in case is correct

ALGOBTC | A strong bullish setup for end of Jan 2021Hey friends, hope you are well and welcome to the new update on Algorand (ALGO).
On weekly chart, the price action of ALGO coin is at the strongest down trendline support.
While the priceline is at the support the stochastic has given bull cross, RSI is in uptrend and the MACD indicator has given weak buying signals on weekly chart.
On daily chart, the price action of ALGO coin has completed the harmonic Gartley move and entered in potential reversal zone. Here we have a support of 25 SMA in buying zone. The 50 and 100 simple moving averages are also moving down to form bull crosses with each other.
On long-term weekly chart the priceline has completed a bullish Shark harmonic move and at the moment the price action is moving within the potential reversal zone.
The priceline may move at this level uptil the end of Jan 2021. Because the ichi moku bearish cloud is showing weak bearish cloud signals at that time. So a powerful rally can be expected at the end of Jan 2021.
Conclusion:
The price action has a support of strong trendline, the bullish Gartley is completed and also a bullish Shark move is another strong bullish signal. But the trendline or PRZ level or Shark should be used as stop loss to minimize the risk.

ALGOBTC is inside a huge descending channel 🦐ALGOBTC is inside a huge descending channel and the price is trying to have a breakout from daily resistance. IF the price will have a breakout and retest the previous resistance as new support, According to Plancton's strategy (check our Academy), we can set a nice order
Daily
–––––
Follow the Shrimp 🦐
Keep in mind.
🟣 Purple structure -> Monthly structure.
🔴 Red structure -> Weekly structure.
🔵 Blue structure -> Daily structure.
🟡 Yellow structure -> 4h structure.
⚫️ Black structure -> <4h structure.
Here is the Plancton0618 technical analysis, please comment below if you have any question.
The ENTRY in the market will be taken only if the condition of the Plancton0618 strategy will trigger.

AlgobtcAlgorand is msking a reverse head and shoulder and if this pattern work we can go up good
I set stop loss in the chart but you can set yours
I wish you all a good trade
Short midterm

$ALGO BTC | UPDATE HUGE!! - 4H Bullish Divergence 🚀 51% RR 3.17BINANCE:ALGOBTC
Order filled!
Updating the chart below

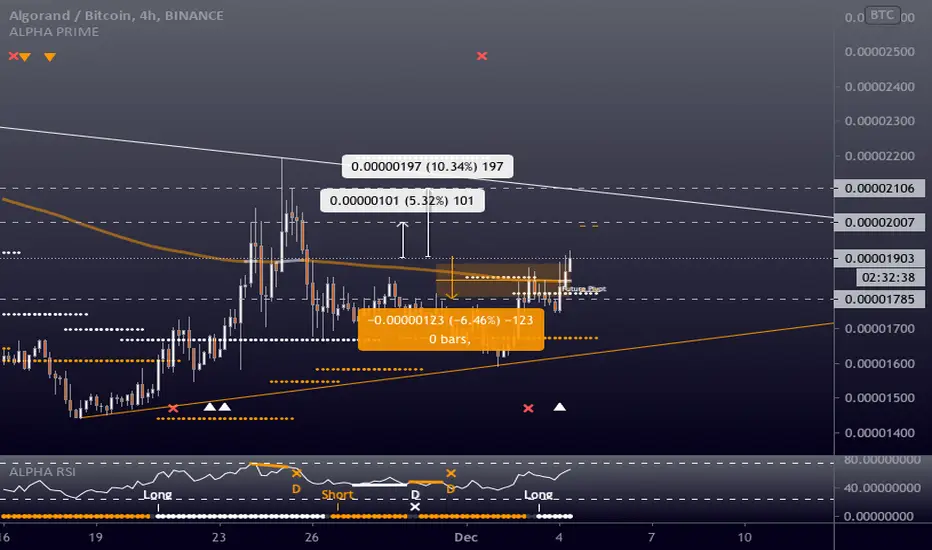
ALGOBTC - Long - Potential 10.34%ALGOBTC - Long - Potential 10.34%
Entry- 1909
TP1- 2007
TP2- 2106
SL- 1785
- BTC on 3rd retest imminent - Take profits when you can
- RR - 1.60
- Trailing Buy - 0.5%
- Trailing Profit - 1%
- Trailing Stop-Loss - No
ALGO/BTCi see head and shoulders here and after big correction it can go up from here good buy after break white trend line


Algorand (ALGOBTC) Trade Signal (203%)ALGOBTC
BUY: 0.00001600 - 0.00001850
TARGET:
1) 0.00002150
2) 0.00002600
3) 0.00003330
4) 0.00004510
5) 0.00005350
STOP: Close weekly below 0.00001500.
-------------
Patience is key.
Do your own research.
Trade at your own risk.
This is not financial advice.
Namaste.


algorand falling wedge breakuot setupprice is close to breakout if we break here above 1700 sats than we can move higher from here.

UPDATEIdea shared 2 days ago, key area that wanted the price to reclaim. Area reclaimed clearly and gave a chance to buy at a retest, currently in and pretending to hold for the mid term, imo big chance that this are the lows of the current cicle.