ALGO... My Trend LinesHey guys, before reading fully, this idea is full of speculation as major trends in this chart aren't defined to well (In my opinion), this is just an idea up for critiquing and feedback, thanks.
Just threw this together based on Fibonacci retracement support and resistance lines, as well as channels and trend line formations. The Arrow trendlines are based off last ALGO/BTC bull run (a fractal pattern), which is speculation, and more often than not, market doesn't tend to follow. However I included it as a general trend idea of what could take place. The Elliot wave theory which i have plotted is also speculation and should not be considered whole heartedly, however I do see Algorand going up in evaluation, and this is my idea of how it will be achieved. Overall Bullish, and in both a huge descending wedge and descending channel (bullish). The USD evaluation is a much more defined chart, and in my opinion we are in for a small pull back, but overall will complete a 5th wave to the upside. Hence, my ideas for this chart were mostly bullish biased for the long term. Thank you.
ALGBTC trade ideas


Long Looking for a long trade. The chart has respected key levels and I think it's going to respect the current levels as well.


#ALGO - will we see a bullish breakout soon?Hey folks, still on the run with ALGO.
Momentum is on our side as we see a positive trend on the MACD and RSI chart.
Still in a ascending channel and we expect to see a breakout soon.
What are your thoughts? Will we breakout bullish?
Take care guys
-----------------
Disclaimer: Just a traiding idea, no financial advice.

ALGO INVERSE HEAD AND SHOULDERSALGO built an inverse Head and Shoulders.It broke its neckline and made a pull back to it. Its a big signal to move upward if it supports from here.
Entry: 2550-2650 SAT
Targets:
1) 3000
2)3400
3) 3700
4) 4300
5) 4800
6) 6000
7) 6700
8) 8300
9) 9500
10) 11000
Stop Loss: Close mWeekly Below 1800

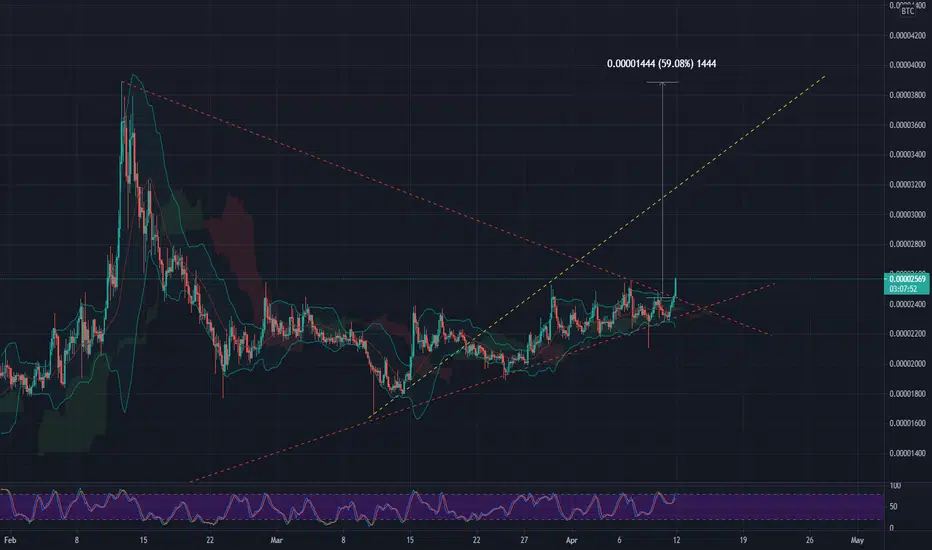
ALGO/BTC going UP 👌This setup has been YEARS in the making.
STOCH RSI on weekly about to break above 80 - "money zone"
Tech unmatched.
ETH at new ATHs.
The stage is set.
Comment your thoughts below!


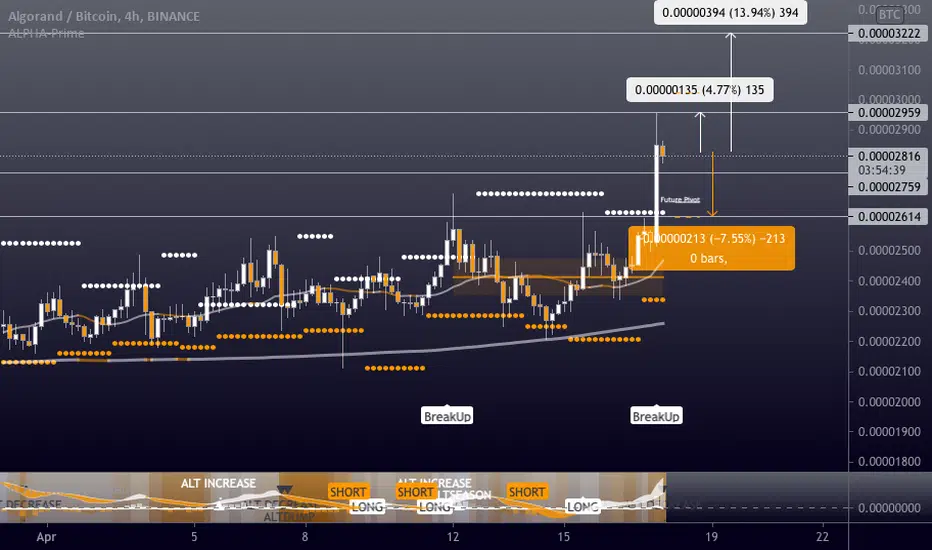
ALGOBTC - Long - Potential 13.94%ALGOBTC - Long - Potential 13.94%
Exchanges: Binance
Signal Type: Regular (Long)
Entry Zone:
0.00002759 - 0.00002792
Take-Profit Targets:
1) 0.00002959
2) 0.00003222
Stop Targets:
1) 0.00002614
Trailing Configuration:
Entry: Percentage (0.0%)
$ALGO* Price is above 200 EMA.
* Retraced to 0.786 Fib level and bounced.
* Bullish MACD.
* Accumulation is going on for about 40 days. Orgasm will happen soon.

ALGO Try not to miss current support zone 2250-2350 before next leg up. This can give at least 30-50%.

The great Setup of ALGOBTC - make yourself ready! Wow, what a solid setup of ALGOBTC. ALGORAND is about to blow us away.
We have seen a great move over the weekend when ALGO has broken the resistance at 02500 Satoshi and was able to find support. We are getting closer to the trendline and I expect a breakout within next days.
EMA, MACD & RSI looks good. ATH is still far away, but on long-term a move close to the ATH is realistic - great project. Easy 1200%!
Fasten your seatbelt, it's getting hot in here...
---------------
Disclaimer: Just an idea, no financial advice!

ALGO .0004 BTC in May?If it keeps testing the bottom of that green ellipse, or better yet breaks inside....

$ALGO, UCTS 1D Buy printed a few days ago (usually strong)$ALGO
UCTS 1D Buy printed a few days ago (usually strong)
Sitting above ~2200 sats & willing to see if its able to flip it as signal of continuation..
If happens, then looking toward ~2700 / 3100 as initial targets..
#ALGO
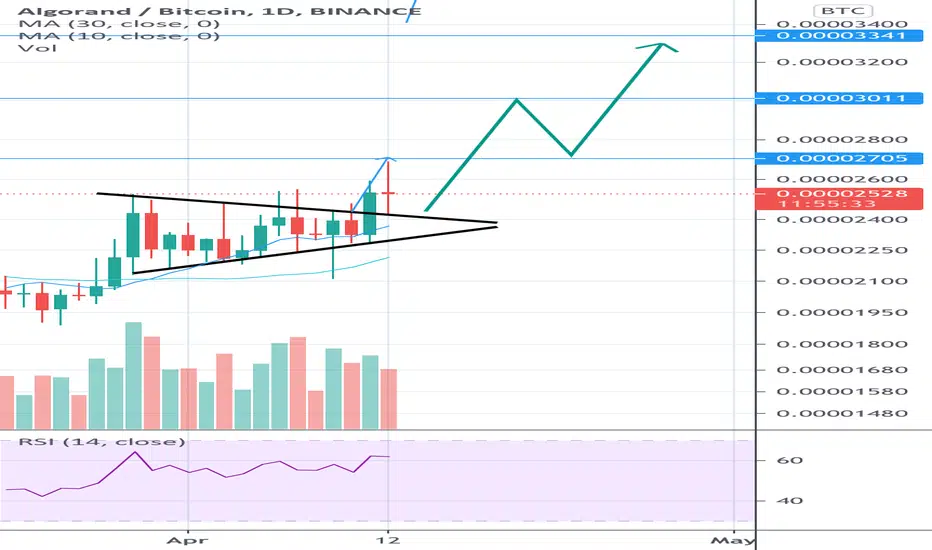
Symmetrical Triangle breakout. Expecting further continuation after reaching the breakout target yesterday. A back test of the top of the triangle has occurred since then. Hold over the triangle for continuation.


Crypto|ALGO/BTC|LongLong ALGO/BTC
Activation of the transaction only when the blue zone is fixed/broken.
The author recommends the use of anchoring fixed the blue zone, this variation is less risky.
If there is increased volatility in the market and the price is held for more than 2-3 minutes behind the activation zone after the breakdown, then the activation of the idea occurs at the prices behind the activation zone.
The idea is to work out the resistance level .
* Possible closing of a trade before reaching the take/stop zone. The author can close the deal for subjective reasons, this does not completely cancel the idea and is not a call to the same action, you can continue working out the idea according to your data, but without the support of the author.
+ Maybe right now we will go even lower, then it's okay, the idea is not activated and simply canceled.
+ ! - zone highlighted by the ellipse is a zone of increased resistance, in this area there is a possible reversal for a correction, please take this factor into account in this transaction.
The "forecast" tool is used for more noticeable display of % (for the place of the usual % scale) of the price change, I do not put the date and time of the transaction, only %.
Blue zones - activation zones.
Green zones - take zones.
The red zone - stop zone.
Working out the stop when the price returns to the level after activation + fixing in the red zone.
Orange arrow - the direction of take.
Black arrow - neutral scenario without activating the trade.
The red arrow - the direction of the stop.
SUM PNL: This parameter displays the total % of all closed ideas of the "new" format (according to the author) for this sector at the time of publication of the idea. The calculation is very "clumsy" just the sum of the profits of all the ideas, based on this indicator, you can more accurately assess the risks when working with my ideas of this sector. I present you the construction of the idea, you can use it yourself as you like based on your subjective view and risks, the calculation of the PNL indicator is carried out only on transactions that the author closed on TV in manual mode or by take.
P.S Please use RM (risk management) and MM (money management) if you decide to use my ideas, there will always be unprofitable ideas, this will definitely happen, the goal of the system is that there will be more profitable ideas at a distance.

ALGOBTC had a nice breakout 🦐The price had a nice breakout from daily resistance. According to Plancton's strategy (check our Academy), we can set a nice order
–––––
Follow the Shrimp 🦐
Keep in mind.
🟣 Purple structure -> Monthly structure.
🔴 Red structure -> Weekly structure.
🔵 Blue structure -> Daily structure.
🟡 Yellow structure -> 4h structure.
⚫️ Black structure -> <4h structure.
Here is the Plancton0618 technical analysis, please comment below if you have any question.
The ENTRY in the market will be taken only if the condition of the Plancton0618 strategy will trigger.


Algo looks bullish. This might be the most bullish scenario that I can see playing out for Algorand. Possible weekly chart price pivot points over the next few years. Not financial advice.
