ALGO - Touched Golden Pocket! What next?Happy Taco Tuesday, Traders!
Hope you find value from this post.
If you did, pls like and consider following.
Here's a trading idea.
But firstly...
==============================
Quick Disclaimer:
Trade at your own risk. This post/chart is for your reference only, it is not intended as a recommendation, nor is it an advice to sell nor buy this crypto asset, nor to place any trade.
Trading poses a risk of losing some or all of your money and it will be your responsibility if you lose money.
==============================
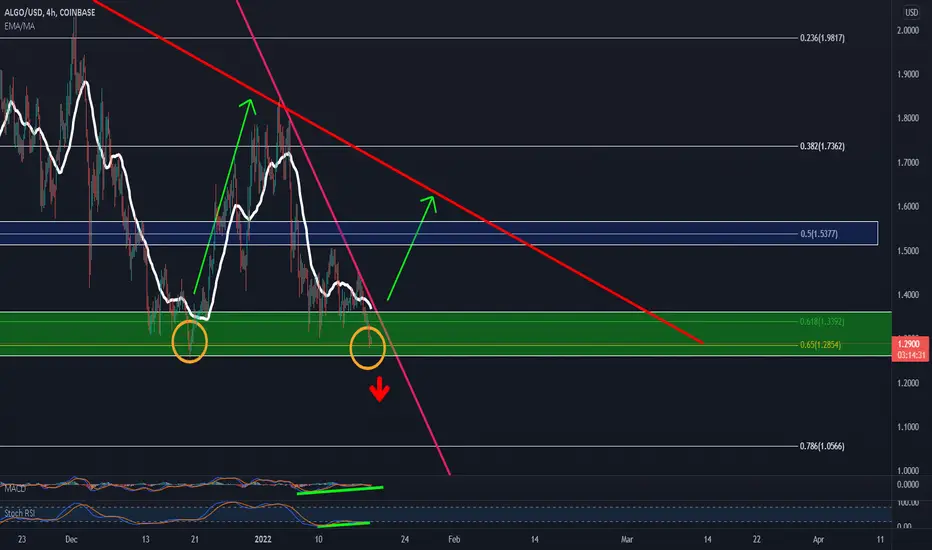
ALGO could be creating a Bullish Double Bottom Pattern, but only a rebound will confirm that.
Falling further past the Green Support Bar could take ALGO down towards the next Fib Level @ 78.6% $1.0566.
A push upwards past the Pink Resistance Trend Line and going above the 21MA could bring ALGO towards 1.5377 Blue Bar, then up towards the Red Resistance Trend Line.
MACD: Potential Bullish Divergence forming
Stoch RSI: Oversold Region, Potential Bullish Divergence forming
Always remember to place your Stop Loss.
Price action is KING!
More power to all your trades, my friends!
Ron
Intrepid_Trader
ALGOUSD.P trade ideas
ADA weekly chart has a great opportunity.ALGO weekly chart...looking really bullish and
staying within the bullish channel. the DeMark 9
Indicator is reading we have h9it bottom and ready to move up.
if it bust major resistance, we can see all time
highs and going toward my price targets. RSI
is also looking bullish

selby_exchange - ALGOUSD - Selby Algorand Fibonacci TestSelby Algorand Fibonacci Test
ALGO
January 16, 2022 - April 09, 2022
"Fib Test"
Custom Fibonacci Retracement Levels
Support of 1.333 or Above is Long Entry
Rejection of 1.111 or Below is Short Entry
Bull Market Continuation is Support of 3.666
Selby finding creative patterns in charts on Tradingview
Not advice for investing, but I am one to watch
Rebellion=Change=Future

Algorand about to pump balls200 day or so pattern pretty clear here. Look for a mega runup starting because it will not stop for 15 to 18 days AS ALWAYS until the blow off around $4.

Algo 1.44$ entryLong position on ALGO/USD @ 1.44$ with stop loss @ 1.30$
I set up a 3 to 1 take profit areas.
first post idno lets see
#RTTA

Still in a Bull Market?If we are still in a bull market I have a date range for the highly anticipated climb to $3.50. As you can see, it is based on the length of time spent between each local top in the mini cycles. The shortest was 24 weeks, and each cycle gets slightly longer. BUT, I think with all the momentum behind algorand, we could see another 24 week type cycle, as opposed to a 35 week one. Either way, I believe Algo will be in the $4-5 range this year.

ALGO VERY BULLISHALGO weekly chart...looking really bullish and
staying within the bullish channel. the DeMark 9
Indicator is reading we have h9it bottom and ready to move up.
if it bust major resistance, we can see all time
highs and going toward my price targets. RSI
is also looking bullish

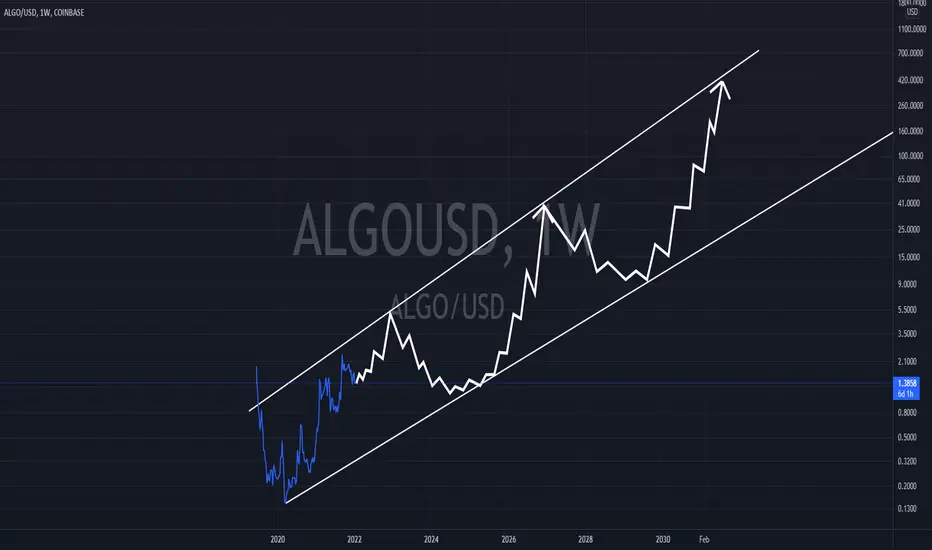
ALGOUSD has bottomed. Next High at $4.00.Algorand's price action has been very straightforward since the start of 2020, as it has been trading within a long-term Channel Up. Every Higher High follows a +0.236, +0.786 +1.0 sequence on the Fibonacci scale and every Bottom is made on the second low following the correction and a Triple Bottom on the 1D RSI (green shape).
If this pattern continues, then ALGO should currently be on its bottom as it is the second low leg since the correction (could be even the third if we count December 04). That makes it a strong buy opportunity on the current levels. A 1D MA50/MA100 Bullish Cross should come as confirmation of the rally but the accumulation process has already started.
Based on the Fibonacci sequence of Higher Highs, the next High should be on the 2.236 Fib extension i.e. somewhere around $4.00.
--------------------------------------------------------------------------------------------------------
** Please support this idea with your likes and comments, it is the best way to keep it relevant and support me. **
--------------------------------------------------------------------------------------------------------

ALGO 12 JAN REBAG SPOT #KetagihanCuanCryptoHi there, it will possibly come, lm waiting *long position* on ALGO , type: swing / SPOT
⚠️ Entry position 1 : 1.3793
⚠️ Entry position 2 : 1.3542
🚀 Take Profit 1 : 1.551
🚀 Take Profit 2 : 1.66
🆘StopLoss/Average: wait n see
Validity signal : 48 hours.
My rules on trading: You can also read my chart on those line, orange as entri, green as take profit, and red as stoploss/average
. IF you are using 20x leverage, and if it get 40% profit, i usually take profit 50% and move SL higher.
,Money management: 2-5% of total margin
You still can lose ur money if u use my signal
Regard, Ade HP ketagihancuantrading

Algo price movement over the next wave cycleBased on the previous movements analysis, i've extrapolated trend lines from the first cycle of this upwards moving wave to get a look at what we could see in terms of the next dip, which may be down to around 1$, followed of course by another rising wave that could go as high as 2$ if the overall trend continues its momentum. If we don't see a continuing upwards trend, I would look at a more conservative high of 1.75 to 1.80 on the next crest, depending on if it will mellow out into a more neutral cycle, or if it will potentially fall into the next lower bracket (highs of 1.25, lows of 0.85 ) again.

Strong Support at 1.25 for AlgoAlgorand has flipped on this 1.25 line several times in the last year. I have at least 6 highlighted, but there are a few more smaller cases.
I suspect we'll lose the support and fall to 1.07 if BTC is really going full bear. Otherwise we'll see a strong move up, especially as algo gets more institutional interests.

ALGO - LONGALGO is getting ready for pump.....buy on 18 jan 2022
Like this idea ? Please do a thumbs up. Thank you for watching.

ALGORAND $400 BY 2030 OR BEFORE O_O- ISO20022 COIN it will do really well long term, Trillions will flood into this coin long term!!
$ALGO WeeklyLooks as if ALGO is retesting the 55ema for the 3rd week in a row.
This area of support is also an area of confluence with the trend-base fibo zero-line and the volumetric s/r line (white) as well.
Everything depends on BTC, but I think ALGO sees a healthy recovery, smashes ath and goes into price discovery mode. Hopefully before spring!
Goodluck!

Long algo from range bottom range established from deviations after tapping liquidity +- extremes, currently byllish from sfp

ALGO: an ideal time to bounceALGO may have already bounced from the FIBONACCI 61.8% at 1.27 which coincides with the uptrend line & 50W ma. ABC correction most likely completed.
Next resistance will be 2.0 & then 2.35 which is exactly the 61.8% FIBO retracement of 3.0 top to 1.27 low.

Fib Fractal ALGO Long SetupKRAKEN:ALGOUSD The high and low pivots for ALGO have followed an interesting pattern of retracement over the past few years. Wild idea, but suppose the price revisits the 0.618 or 0.786 level over the next week or so, then pumps back to the next 3.0 line. We'd be at $5.00 before the summer.
Dumb idea, do your own research, whatever.

Algo Expect Sideways ActionI expect Algo to move sideways for a couple of weeks here between 1.42-1.58. If it manages to break to the upside expect 1.80 to serve as strong resistance. If it breaks to the downside expect 1.23 to serve as strong support.

Rise of ALGOALGO was one of the L1 laggards of 2021, along with ATOM. I believe these two play catchup to SOL, AVAX, LUNA, etc. in Q1 2022.
Undercut the local lows for some liquidity and swinging back around into the range. Forming a mini flag and looks like it wants to breakout soon towards $2-2.10 which is the major resistance area.
Given we've already had a failed move, think the probably of success is much greater. New ATHs this month is a real possibility, especially given ATOM is already at the highs and these two see, to mostly trade together (similar charts).

ALGOUSDT UPDATEALGO is trading inside of this ascending channel from a weekly and daily perspective, despite short term bearish market conditions we can still see strong buying pressure. I am very bullish on ALGO for 2022 i believe it could be one of the best performers. Looking for a rally to the top of the ascending channel if prices manages to break above the corrective counter trendline.

Algorand ($ALGO) New FIBAlgorand ($ALGO) New FIB: $ALGO looks ready to break out on a mini-pump. RSI heading straight to the upper boundary with MACD looking healthy. BB squeezed and looking for a close and confirmation above upper BB (this resistance has been tested 8 times in as many days)

ALGO/USD ChartHi, I try to post often so if you could follow and like it would mean a lot to me.
ALGO is very bullish right now and is ready to move towards 2$. The FOMO on the coin is amazing, the 4H and 1D charts are looking amazing.
The coin broke the 1.50$ resistance a few days ago, and after having a bullish retest, the coin looks ready to skyrocket. I don't have to much to say, but right now BTC is moving sideways in between the 45K-48K, and the best way to be profitable right now is in alts that are showing strenght (like ATOM and ALGO).
Please comment what you think and check my recent ideas!
