ALGOUSD trade ideas
H&S on $ALGO
H&S almost reached the target move. If you missed an entry on EURONEXT:ALGO , this might be a good entry buy. Head and Shoulders

$ALGO target between $0.9 & $1.1my analysis is based on double bottom reversal and completion of 5 waves and reaching the important zone of 0.9 and 1, which is always an important zone and also fibbo confirms that zone too
Algorand breaking up from inverse head and shouldersSeems like most of the cryptos from the iso20022 compliant chains are breaking out right now and algorand is no exception. Most likely in anticipation of Fednow’s migration to it tomorrow. *not financial advice*

Volatility inboundALGO is about to break out of the LPS.
TEST has been broken through.
ALGO is a BUY BUY BUY!
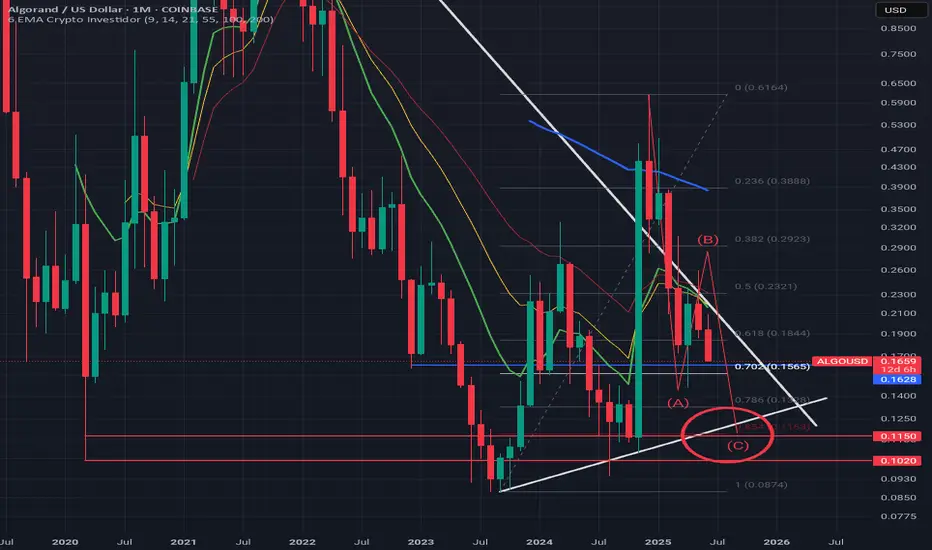
$0.10 inbound. BUY OpportinityIMO, were going to backtest the 2020 lows, and complete the ABC correction/C Leg down to the 0.854FIB and wick down into the $0.10s if you can catch a falling knife and go LONG!!!
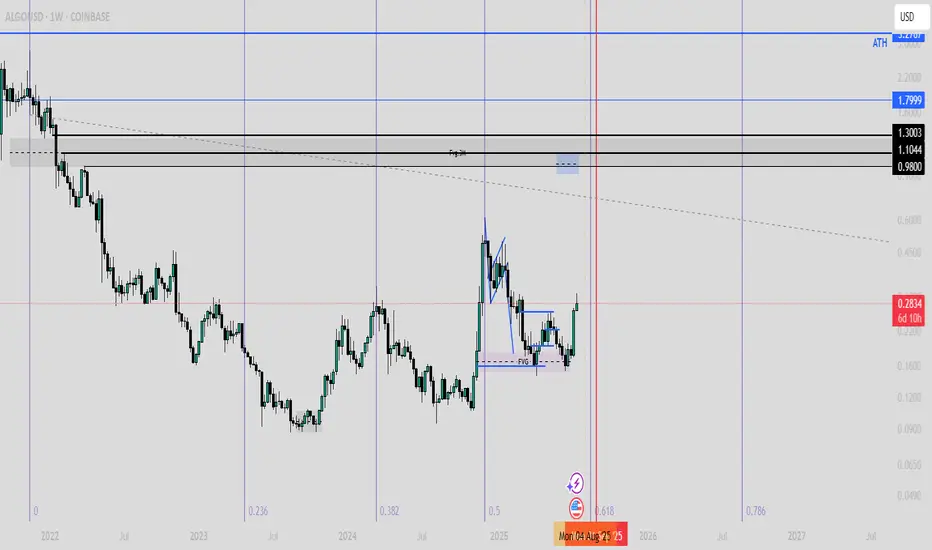
Jump the Creek or Spring?BTC has broken the ATH, will it drag the ALTS including ALGO to skip SPRING or will it Jump the Creek and go to LPS/SOS?
Your thoughts?

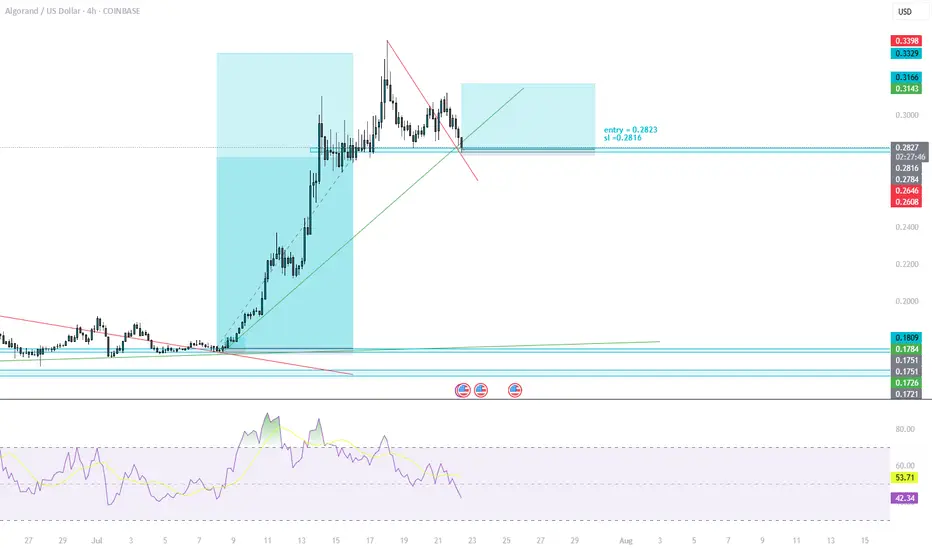
buy entry algoContinuation of upwards movement:
-Trendine retest Red
-Trendline Fakeout Green
-Fib completion to the upper side (last impuls respected 0.6fib)

Algorand Inverse H&S
Algorand EURONEXT:ALGO inverse H&S developing, target .48, need to close .26 daily.

ALTCOIN BOOM FOR ALGORAND 2025-2026 PROPOSALAlgorand ( EURONEXT:ALGO ) is a layer-1 blockchain designed for speed, scalability, and sustainability. It uses Pure Proof of Stake (PPoS) to achieve fast, low-cost transactions while maintaining decentralization. Algorand’s niche is bridging TradFi and DeFi, with a focus on real-world assets (RWAs), CBDCs, and institutional adoption. Think of it as the “green Ethereum” with a compliance-friendly edge.
Recent News Launched “Algorand 2.0” with quantum-resistant cryptography and dynamic NFT standards. Secured a partnership with the IMF to pilot a cross-border CBDC project. EURONEXT:ALGO rallied 25% in July after months of stagnation, but still lags behind major layer-1 tokens.
Deep Dive Algorand’s quantum-resistant upgrade is a sleeper hit. While others focus on speed, ALGO is future-proofing against quantum hacks—a unique selling point for risk-averse institutions. The IMF partnership is HUGE, positioning Algorand as a potential CBDC backbone, but progress will be slow (TradFi moves at a glacial pace). Competitors like Hedera and Ripple are ahead in enterprise adoption, so ALGO needs to accelerate development.
Latest Tech or Utility Update
Update Details Algorand 2.0 introduced quantum-safe encryption, dynamic NFTs (updatable metadata), and “State Proofs” for trustless cross-chain interoperability.
Implications Quantum resistance is a long-term bet, but it’s a marketing win for institutional clients. Dynamic NFTs could revolutionize gaming and IP licensing. State Proofs allow Algorand to interact with chains like Bitcoin and Ethereum without bridges, reducing exploit risks. However, adoption depends on other chains integrating Algorand’s tech—a chicken-and-egg problem.
Biggest Partner & How Much Was Invested
Partnership Spotlight The International Monetary Fund (IMF) is testing Algorand for a multi-country CBDC network. No direct investment, but a 3-year technical collaboration.
Impact Analysis If the IMF pilot succeeds, Algorand could become the go-to chain for central banks. This would create significant demand for EURONEXT:ALGO as a settlement layer. However, CBDCs are politically charged—regulatory backlash could slow adoption.
Most Recent Added Partner & Details
New Collaboration Partnered with Circle to launch EURC and USDC natively on Algorand, enabling near-instant settlements. No funding disclosed, but revenue-sharing on stablecoin transactions.
Future Prospects EURC/USDC integration makes Algorand more attractive for DeFi and remittances. Short-term, this boosts liquidity; long-term, it could position ALGO as a Euro-on-ramp for institutions.
Tokenomics Update
Token Dynamics Fixed max supply of 10B EURONEXT:ALGO , with 7.3B already in circulation. Governance rewards slashed to 6% APY (from 8%) to reduce inflation. New burn mechanism: 0.1% of transaction fees destroyed monthly.
Deep Analysis The hard cap is bullish, but slow burn rates won’t offset inflation from vesting tokens. Lower governance APY might deter casual stakers, but it tightens supply. Algorand’s tokenomics still lack the deflationary firepower of ETH or BNB.
Overall Sentiment Analysis
Market Behavior Mixed bag: Retail remains cautious (social sentiment neutral), but whales are quietly accumulating. ALGO’s price is still 90% below its ATH, creating a “cheap layer-1” narrative.
Driving Forces CBDC hype and quantum-resistance FOMO. Critics argue Algorand’s marketing lags behind its tech, and ecosystem growth is too slow compared to Solana or Avalanche.
Deeper Insights Sentiment hinges on the IMF partnership delivering tangible progress. If the CBDC pilot stalls, ALGO could re-enter “zombie chain” territory.
Recent Popular Holders & Their Influence
Key Investors VanEck added EURONEXT:ALGO to its digital assets portfolio. Crypto whale "0x5a1D" bought 10M EURONEXT:ALGO in July, now a top 50 holder.
Why Follow Them? VanEck’s move signals institutional interest in Algorand’s CBDC potential. Whale “0x5a1D” has a history of accumulating undervalued layer-1s before rallies (e.g., bought DOT at $4 in 2023).
Summary & Final Verdict
Recap Algorand is a tech-first chain with strong partnerships (IMF, Circle) and cutting-edge upgrades (quantum resistance). However, its ecosystem growth lags, and tokenomics lack urgency.
Final Judgment EURONEXT:ALGO is a high-risk, high-patience play . It could 5x if CBDCs take off or quantum security becomes a priority, but institutional adoption takes time.
Considerations Can Algorand onboard enough devs to escape the “ghost chain” label? Will the IMF partnership lead to real CBDC deployments, or just research papers? How will ALGO’s inflation schedule impact price if adoption remains slow?
If you're bullish on CBDCs and quantum-resistant tech, accumulating under $0.20 could pay off long-term. If you prefer faster-moving projects, look elsewhere.

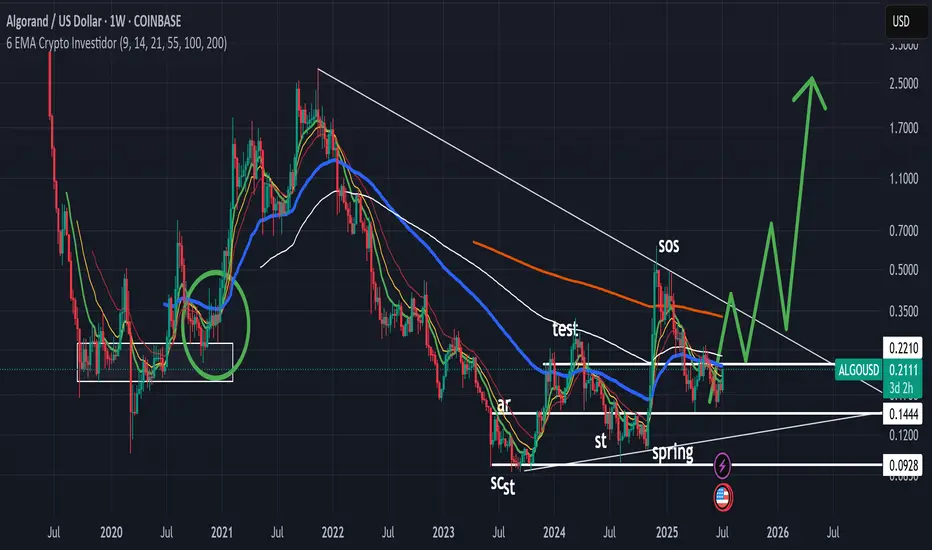
Macro Wyckoff viewalgo is about to enter LPS in phase D and is a strong buy.
potential retest $0.20-$0.17, and bullish sentiment and a break through the 200ma.

We see greater potential in AlgorandWe see greater potential in Algorand, but we can't say with certainty that it will rise during this bull run. I believe the projects behind Algorand have a strong impact and could trigger significant hype. We're approaching a breakout point that could lead to another move upward. If we break through the $0.47 level, we would turn bullish and could expect the beginning of a hype cycle.

Algorand Consolidation "Pointing" To An End??Here we can see COINBASE:ALGOUSD is about finished forming a Continuation Pattern, the Bullish Wedge!
Price has made an impressive .50 increase since Trump taking office but has slipped into quite a steep Consolidation Phase where Price has made run for the 88.6% Retracement and seems to be filling out the rest of the "Point" of the Wedge!
Accompanying the Chart Pattern is a Decrease in Volume as well, signaling the tight Consolidation could be looking to make a break soon!
*With a True Breakout, we will want to be vigilant of multiple factors coming into play with Increase of Volume to Validate the Break of Pattern!
Once the Pattern is Confirmed and a Breakout Validated, based on the "Flagpole" of the Pattern, we could expect a potential extension of price to go behind the current Swing High of .6133 and up into the .70 area!

ALGO looks like an absolute beauty at this pointALGO looks like an absolute beauty at this point,
TP1: 1.95$ / 50%
TP2: 12$ / 100%

ALGO Ready to Break Out—or Fake Out? Watch This Critical ZoneYello, Paradisers! have you been watching #ALGOUSD’s recent moves closely—or are you about to miss the bounce that could catch 90% of traders off guard?
💎After topping out in December 2024, ALGO entered a clear corrective phase. That correction just completed an ABC zigzag pattern right into a strong support region, slightly above its key weekly level—a zone where buyers historically step in.
💎#ALGOUSDT is showing clear bullish reactions between the 0.165–0.145 levels. More importantly, a complex bullish divergence is forming—on both RSI and MACD. This is your first warning sign that the bears are losing steam and bulls are ready to step back into control.
💎On the upside price must break and hold above the moderate resistance zone at 0.22 level. A successful reclaim here would not only validate the divergence but also represent a deviation reclaim, where price recovers a previously broken support level.
💎If this reclaim is successful and supported by volume, the next key zone to monitor is between 0.25 and 0.275. This region carries particular significance, as it aligns with both the descending trendline resistance and the 25% Fibonacci retracement. It is a critical level that will likely determine whether the current bounce evolves into a sustained bullish leg.
💎Should buyers maintain momentum beyond that point, the next upside target lies between 0.365 to 0.380 levels.
Paradisers, strive for consistency, not quick profits. Treat the market as a businessman, not as a gambler.
MyCryptoParadise
iFeel the success🌴

Algo is finishing its Bull flag and price could reverse soonAfter nice movement in december Algo formed massive bull flag pattern and looks like price is reversing.
RSI formed double top and dropped to 30 where it found support. RSI has started to move up, creating higher lows.
StochRSI is moving up - momemtum is building up.
Targets for next leg up are between 0.94$ and 1.4$ (400-600%)

ALGO trading on a key support, a buy at sub 0.20Algo remains competitive and affordable vs the competition. PSAR pending signal to the upside, currently trading on a key support!

ALGO/USD Strong Support📊 Technical Analysis Overview:
✅ Price Action & Candles:
The latest Heikin Ashi candle is a strong green, signaling early bullish momentum.
Current price is around $0.214, showing a clear bounce from the recent low at $0.175.
Potential double bottom pattern forming, which is typically bullish if confirmed.
📉 EMA (20/50/100/200):
Price is still below all major EMAs, especially the 100 and 200 EMA, indicating the long-term trend remains bearish.
However, the price is now testing the 20 and 50 EMA – breaking above them could confirm a short-term uptrend.
☁️ Ichimoku Cloud:
Price is still below the Kumo (cloud) – a bearish sign in the bigger picture.
The future cloud is flat and wide around $0.29, signaling strong resistance ahead.
A break above the cloud would be a strong bullish signal.
🔄 Fibonacci Retracement:
Bounce from 0% level ($0.175), aiming for 23.6% ($0.293) as the next resistance.
A bigger rally could reach 61.8% retracement at $0.484.
📉 RSI (Relative Strength Index):
RSI is currently around 39.28, rising from the oversold zone.
A break above 50 would confirm stronger bullish momentum.
📈 MACD (Moving Average Convergence Divergence):
A bullish crossover just happened: MACD line crossing above signal line.
Histogram is turning green – showing growing bullish momentum.
Previous bullish wave lasted 9 bars (~27 days), so a similar rally could be starting.
⏳ Time Cycles:
Chart shows 72-bar (~216 days) cycles, possibly suggesting a new bullish phase beginning now.
📌 Summary & Trade Plan:
Near-term Target Mid-term Target Strong Support
$0.24 - $0.29 $0.48 (Fib 61.8%) $0.175
If holding: Worth holding if price breaks above EMA 50 and approaches $0.24–$0.29.
If considering buying: Entry between $0.21–$0.22 could be a good swing trade setup.
Stop-loss: Below $0.175 (key support).

ALGOUSD Bearish ForecastHi there,
Due to two supply area zones pressing down on a Fib bias of 0.1733, ALGORAND looks bearish and could drop to 0.2026.
Happy Trading,
K.
Not a trading advice

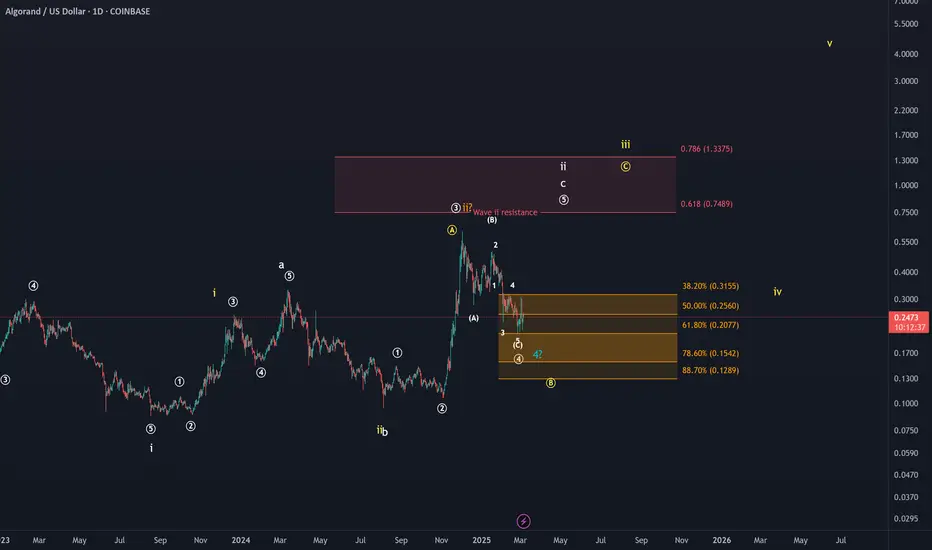
ALGO (Algorand) Altcoin Analysis. One More High in this Cycle?ALGO: The price is currently testing the 61.8% retracement level, which is the last relevant support level for wave 4 in the white scenario. While the idea of a fourth wave pullback will not be invalidated below this level, other interpretations will become more likely. The orange scenario allows for the interpretation that a long-term price top has been established, but this is currently not yet seen as preferred scenario. A wider wave B correction would be a likely alternative, should the price break below $0.20. However, due to the questionable chart context, such as a 5-wave move down into the 2023 lows, I do not expect new all-time highs to be reached in this cycle.
ALGO to provide us with some GAINS as well?Hi guys,
Again as seen on the chart and historic price action or ALGO we can clearly see the PAIN points of where price is reacting and providing opportunities.
If we manage to break this trendline my first BUYS will begin at $0.16.
Risk here is holding drawdown of around -26% if price drops towards second area, so yes, in my eyes it is worth it!
Second area of accumulation and buying ALGO would be my ALL IN BUY ZONE from $0.10 to $0.14.
Potential gain from first zone towards our first target - HIGH of this cycle in 2024 is 280%!
Potential gain from ALL IN BUY ZONE is around 400%!
Second TP zone would be of course psychological level $1 where our gains from first buying area would be around 500% and from the second area would be around 700%
Please invest only what you are willing to lose, play it smart and be patient as patience is the key.

Will ALGORAND'S 'anti Trump' management team kill the project?ALGORAND has some serious potential in regard to its technology and its use case, but it’s well known that the people behind ALGO are publicly—and unfortunately loudly—against Trump and his agenda to 'Make America Great Again' and to make 'America the crypto capital of the world.'
I like ALGORAND's project and technology, but I also think that the management's inability to keep their political opinions to themselves, and instead focus on their business model, could end up working against ALGO over the next four years. I think it’s not only a bad idea to take a public political stance as they have when you have a business to run, but their poor judgment could severely hurt ALGO investors over the course of the current administration. But, let’s hope that isn’t the case.
Good luck, and always use a stop loss!
