Harmonic Decomposition of Trend Exhaustion - - ALGOUSD (1h)L I N E - W O R K : The foregoing, and more, populate my Object Tree, which is summarized as a separate item, below. Any line or drawing tool that I use frequently is saved as a color-coded template for rapid repetition.
Fib Space - A concrete Leading Indicator comprising several overlapping Fibonacci Trend-Based Extensions and a Retracement or two. Rather than to find Support & Resistance, its purpose is to target Volatility as the areas between highlighted zones.
AVWAP Array - A fluid Leading Indicator comprising several overlapping Anchored VWAPs, as well as some some standard and nonstandard deviations and anchor-points. Although Price itself behaves violently when interacting either with VWAPs, experience shows that the crossing of key VWAPs is a Leading Indicator of high Volatility. Among the VWAps, three in particular deserve special attention, namely the 1.272 Std Deviation VWAP since the chart’s inception, below the current price, as well as those marked by this year’s dates of 2.24 (two-tone red) and 9.8 (two-tone green), above the price.
Further line-work includes a Schiff Pitchfork implied by the right wing of the pattern (points ABC), and a section of a larger bullish arrow consequent to a larger Bullish Harmonic Reversal Pattern that does not fit within the hourly chart.
Notice the use of S-Curves as projected future trend lines, following the conservative path of Maximum Market Pain. Price is like a pendulum. It does not move in straight lines; rather, it describes the struggle between buyers & sellers pulled into maximum commitment before shorter term swings.
See below for more on Harmonics.
. . . . . . . . . . . .
V O L U M E : The various horizontal histograms of volume simply indicate accumulation and distribution. Volume Profiles, however, serve two purposes. 1) As a Lagging Indicator, to discover ranges of Supply & Demand, and the all-important Mean, and 2) as a Leading Indicator to corroborate entries, profit targets and stop-losses, as well as any discretionary management of the latter, if needed. Notice that each day, beginning with the Tokyo Session at 12:00 UTC, has its own 24-hour Volume Profile (see the Object Tree, below).
None of these are as useful as the custom construction in my Object Tree under the name AWAP Array.
In this case, Volume has been healthy partially due to the ongoing FTX Crash (as of this writing), and ALGO tends to have high Volume in general, making it a good indicator of the health of the sector. A recent spike in selling has dropped price to point C which, for those less familiar with them, is NOT considered complete until confirmation at D.
. . . . . . . . . . . .
V O L A T I L I T Y : This is the least understood of the the three fundamental axes of trading, or at least of my style. In any timeframe, price rises more slowly than it falls, which is to say that Volatility is the opposite of price variation. To see Volatility with any hope of clarity, it is essential to remove innate directional bias. In general, it rises sharply and declines slowly. The Question, even more than HOW FAR?, is WHEN? The mystery of Volatility tests, and rewards, patience.
Generally and in this case, too, the greatest Volatility occurred at X, which coincides approximately the 9.8 VWAP and the midpoint between the price drop begun near the 2.24 VWAP and the bottom of that swing, at A. As expected, there is a rise leading into the midpoint of the pattern, B, which is also the second highest price (so far). Another peak in Volatility may be expected at D, if it is reached.
Again, see below for more on Harmonics.
. . . . . . . . . . . .
T R E N D - E X H A U S T I O N : In order to maximize the Risk:Reward ratio, one must act at the edges, or as close as possible. Therefore, one needs an improving sense of where the potential for reversal is highest BEFORE price reaches it. Like Volatility, and unlike Volume, it is impossible to measure directly, and yet with clean Line-Work and a sound market narrative, or trade thesis, various containment and decomposition techniques exist to estimate probable areas in a chart where price vectors will reverse.
In this case, a Schiff Pitchfork is implied by interwoven patterns, among other evidence. Although the Price Action in the near term may be described by it, a larger Bullish Reversal Pattern (to large for the hourly chart) appears to have completed as well, implying an even larger set of Pitchforks.
. . . . . . . . . . . .
H A R M O N I C S : Whether by definition or analogy, harmony implies cooperation between two or more agents. To draw X5 patterns without understanding which elements one seeks to reconcile is like a chimpanzee playing with an iPad. When I draw them, I visualize the interplay of 1) the Range between Supply & Demand, 2) the Volume Spread and 3) Probability over Time.
In this case, in addition to the much larger (green) Bullish pattern completing, a smaller such pattern can be seen in the (red) Bearish Reversal Pattern whose CD Leg comprises the vector of the trade. In effect, the trade can also be seen as the AD Retracement of the smaller Harmonic Bull, since it coincides with the ABC Fib-Based Trend Extension.
Upon the Red W-Pattern are superimposed two smaller bullish patterns, one completed and one potential. Of these, the second marks a point, or an area, of risk along CD Leg.
. . . . . . . . . . . .
F O R E C A S T : Trading the CD Leg of a Reversal Pattern is technically premature, and risky. In this case, not only the coincidence of the Fib ratios but several factors of the Big Picture, as well as the Indicators make this a decent t proposition. As always, there is a point between 1/2 and 2/3 up the vector when it will be tested (and where it tends to fail, if it does fail) therefore some profit may taken along the way. Considering the high R:R Ratio and the duration of the swing, it’s not a bad idea to de-risk.
On this timeframe as of this writing, price is testing the 1.0618 custom “Overthrow” line in the template marked as a “Moving Stop Loss”. Considering recent price drops, this retest near the prospective bottom suggests support rather than a further run to the downside. Also, being a holiday weekend with other markets closed, crypto may indeed have an upsurge due to bored and/or her-eager traders. Setting the left edge of the window to the peak above X, near the 8.9 VWAP, shows the Point of Control of the Visible Range Volume Profile to be above the current price, further suggesting a price reversal in this zone.
_____________________________________________________________________
O B J E C T - T R E E :
The most overlooked tool in Tradingview is the Object Tree. When cleverly rooted, it enables the chartist to arrange (i.e layer) the Drawings and Indicators (if any) and then selectively toggle them on and off.
I am sometimes asked about my suite of indicators, which I have listed below, per the order in which they are layered. (The settings I use are beyond the present scope.) A more relevant detail is that the major Volatility Indicators are placed in the upper windows while those which measure Volume appear in windows below the price action.
In the main window, the preference is inverted. Any original Line-Work that I might create is collected beneath all (12) Indicators.
Again, the purpose of this groundwork to deliberately overlap objects and to selectively turn them on or off like light bulbs in order to discover and/or important but not obvious facts about the potential action space.
. . . . . . . . . . . .
Tesla Coil
____________________________________
Average Volatility Movement
____________________________________
Buying & Selling Pressure
Average True Range (Line)
Average True Range (Histogram)
____________________________________
ALGOUSD, COINBASE, 1h
Indicators VSA v6
Volume Pressure Analysis
Time Segmented Volume Bands
Visible Range Volume Profile
Periodic Volume Profile
Daily High/Low/Mid/Open/Close+Weekly/Monthly Open
Volatility Stop MTF
Volatility Bands by DGT
Double SuperTrend ATR
Moving Average Shaded Fill Area Crossover EMA
Moving Average Ribbon
>📁”Object Group 1”
>📁”Object Group 2”
>📁”etc.”
____________________________________
Time Segmented Volume Bands
____________________________________
Heatmap Volume
Volume Analysis
Time Segmented Volume Bands
. . . . . . . . . . . .
R E M A R K S : I will attempt to post a larger, higher timeframe view of the position, showing the major Bullish Reversal possibly beginning, or at least the end of selling pressure.
🧸
ALGOUSD trade ideas

Trading CD Leg of Harmonic Pattern: 7.77:1 Long ALOGUSD (1h)L I N E - W O R K : The foregoing, and more, populate my Object Tree, which is summarized as a separate item, below. Any line or drawing tool that I use frequently is saved as a color-coded template for rapid repetition.
Fib Space - A concrete Leading Indicator comprising several overlapping Fibonacci Trend-Based Extensions and a Retracement or two. Rather than to find Support & Resistance, its purpose is to target Volatility as the areas between highlighted zones.
AVWAP Array - A fluid Leading Indicator comprising several overlapping Anchored VWAPs, as well as some some standard and nonstandard deviations and anchor-points. Although Price itself behaves violently when interacting either with VWAPs, experience shows that the crossing of key VWAPs is a Leading Indicator of high Volatility.
In this case, further line-work includes one of the Pitchforks implied by the right wing of the pattern, and a section of a larger bulls arrow consequent to a larger Bullish Harmonic Reversal Pattern that does not fit within the hourly chart
. . . . . . . . . . . .
V O L U M E : The various horizontal histograms of volume simply indicate accumulation and distribution. Volume Profiles, however, serve two purposes. 1) As a Lagging Indicator, to discover ranges of Supply & Demand, and the all-important Mean, and 2) as a Leading Indicator to corroborate entries, profit targets and stop-losses, as well as any discretionary management of the latter, if needed. None of these are as useful as the custom construction in my Object Tree under the name AWAP Array.
In this case, Volume has been healthy partially due to the ongoing FTX Crash (as of this writing), and ALGO tends to have high Volume in general, making it a good indicator of the health of the sector. A recent spike in selling has dropped price into the C-Point of the pattern which, for those less familiar with them, is NOT considered complete until confirmation of the D-Point.
. . . . . . . . . . . .
V O L A T I L I T Y : This is the least understood of the the three fundamental axes of trading, or at least of my style. In any timeframe, price rises more slowly than it falls, which is to say that Volatility is the opposite of price variation. To see Volatility with any hope of clarity, it is essential to remove innate directional bias. In general, it rises sharply and declines slowly. The Question, even more than HOW FAR?, is WHEN? The mystery of Volatility tests, and rewards, patience.
Generally and in this case, too, the greatest Volatility occurred at the X-Point, which coincides approximately with the two-tone Green VWAP and the midpoint between the price drop begun near the two-tone Red VWAP and the bottom of that swing, at the A-Point. As expected, there is a rise leading into the midpoint of the pattern (B), which is also the second highest price (so far). Another peak in Volatility may be expected at point D, if it is reached.
. . . . . . . . . . . .
T R E N D - E X H A U S T I O N : In order to maximize the Risk:Reward ratio, one must act at the edges, or as close as possible. Therefore, one needs an improving sense of where the potential for reversal is highest BEFORE price reaches it. Like Volatility, and unlike Volume, it is impossible to measure directly, and yet with clean Line-Work and a sound market narrative, or trade thesis, various containment and decomposition techniques exist to estimate probable areas in a chart where price vectors will reverse.
In this case, a Pitchfork is implied by interwoven patterns, among other evidence. Although the Price Action in the near term may be described by it, a larger Bullish Reversal Pattern (to large for the hourly chart) appears to have completed as well, implying an even larger set of Pitchforks.
. . . . . . . . . . . .
H A R M O N I C S : Whether by definition or analogy, harmony implies cooperation between two or more agents. To draw X5 patterns without understanding which elements one seeks to reconcile is like a chimpanzee playing with an iPad. When I draw them, I visualize the interplay of 1) the Range between Supply & Demand, 2) the Volume Spread and 3) Probability over Time.
In this case, in addition to the much larger (green) Bullish pattern completing, a smaller such pattern can be seen in the (red) Bearish Reversal Pattern whose CD Leg comprises the vector of the trade. In effect, the trade can also be seen as the AD Retracement of the smaller Harmonic Bull, since it coincides with the ABC Fib-Based Trend Extension.
. . . . . . . . . . . .
F O R E C A S T : Trading the CD Leg of a Reversal Pattern is technically premature, and risky. In this case, not only the coincidence of the Fib ratios but several factors of the Big Picture, as well as the Indicators make this a decent proposition. As always, there is a point (orange) between 1/2 and 2/3 up the vector when it will be tested (and where it tends to fail, if it does fail) therefore some profit may taken along the way. Considering the high R:R Ratio and the duration of the swing, it’s not a bad idea to de-risk.
_____________________________________________________________________
O B J E C T - T R E E :
The most overlooked tool in Tradingview is the Object Tree. When cleverly rooted, it enables the chartist to arrange (i.e layer) the Drawings and Indicators (if any) and then selectively toggle them on and off.
I am sometimes asked about my suite of indicators, which I have listed below, per the order in which they are layered. (The settings I use are beyond the present scope.) A more relevant detail is that the major Volatility Indicators are placed in the upper windows while those which measure Volume appear in windows below the price action.
In the main window, the preference is inverted. Any original Line-Work that I might create is collected beneath all (12) Indicators.
Again, the purpose of this groundwork to deliberately overlap objects and to selectively turn them on or off like light bulbs in order to discover and/or important but not obvious facts about the potential action space.
. . . . . . . . . . . .
Tesla Coil ML
____________________________________
Average Volatility Movement
____________________________________
Buying & Selling Pressure
Average True Range (Line)
Average True Range (Histogram)
____________________________________
ALGOUSD (1h)
Indicators VSA v6
Volume Pressure Analysis
Time Segmented Volume Bands
Visible Range Volume Profile
Periodic Volume Profile
Daily High/Low/Mid/Open/Close+Weekly/Monthly Open
Volatility Stop MTF
Volatility Bands by DGT
Double SuperTrend ATR
Moving Average Shaded Fill Area Crossover EMA
Moving Average Ribbon
>📁”Object Group 1”
>📁”Object Group 2”
>📁”etc.”
____________________________________
Time Segmented Volume Bands
____________________________________
Heatmap Volume
Volume Analysis
Time Segmented Volume Bands
. . . . . . . . . . . .
R E M A R K S : I will attempt to post updates, and a larger, higher timeframe view of the position, suggesting a major reversal for Algorand (for reasons beyond the scope of the chart alone).
🧸


Accumulate...Like many other alts they are in bargain basement territory - fear is still ruling these markets and bears are celebrating like they have nailed the greatest short on a market down 75%+ - Future is very bright for crypto and I believe we have much better days ahead.

ALGORAND: SIMILARITIES?Hi guys, as i said always, trading is to find similarities in the past to forecast the future with more confidence.
In ALGO i saw this, so i'll wait a new low to try a long position if the market will be more stable.
Maybe tomorrow the market will explode and we won't see a new low, but we can't know.
Let's see.

ALGO might just be reversing to the upsideinverted megaphone with a bear trap. I'd buy heavy if it's confirmed its reversal at this point.

Still Have Some High Hopes with ALGOA Very Clean Bullish Piercing Pattern Might See Some Greens Now!

ALGOUSDTHello TradingView community 🚀 and my followers, please if you like the ideas, don't forget to support them with likes and comments, thank you very much and here we go.
Today I want to talk to you about the ALGOchart.

ALGO Short 🚀Hello TradingView community 🚀 and my followers, please if you like the ideas, don't forget to support them with likes and comments, thank you very much and here we go.
Today I want to talk to you about the ALGO chart.
At the moment price break the structure.
Then, I think ALGO breaks continue to move down to my goal.
My target is located at charts level.
I expect this scenario.
This is my opinion, I really hope it will be useful for you.
Be prepared and save your money. Make big profits!

An even bigger inverse h&s pattern appears on ALGOOn our way to hit the 2 targets I posted about previously from former inv h&s neckline breakouts, algo has now brought price action above an even higher inverse head and shoulder neckline. Stoch RSI is pretty over extended at this point so it would not surprise me at all if we see a dip back down to retest the neckline or even a few wicks or a candle close below the neckline before we are ready to validate the breakout above this new neckline. Of course, it could also just decide it wants to pump all the way to our next measured move target with no correction at all. I will keep hodling, but if I was leveraged i would dial down a good portion of my leverage after hitting the previous targets and try to add it back in upon a successful retest of the new neckline as support…if we do dip below the neckline as long as it holds the 50ma as support any dip below should be temporary. We maintain overall support on the 50 and then solidify support on the white neckline here we will likely validate another inv h&s breakout by the time algo’s golden cross occurs. *not financial advice*

Algorand: Liquidity Voids Hit & Failure to RallyALGO has been predictable with demand volume spiking systematically each time the PA bumps into the micro resistance. These spikes, however, have not been enough to flip the lines. We see that after the LVs are mitigated, down the PA goes, back into the channel to retest micro support and prepare for another attempt. I have no doubt the macro liquidity void (#3) will get hit: the only question is when. If things play out the way I think, I can see us going back down before that happens. ETH is in its own rising wedge, BTC doesn't look so hot either. Be careful, amigos.
*Be sure to subscribe for more easy-to-follow charts with high win ratios (80-85% average) in hitting the Fibonacci profit zones. I've been trading crypto fulltime since 2017 and handpick all the runners myself after conducting a series of volume-to-spread reads and Wyckoff schematic comparisons. Check out my past charts & see the wins for yourself.
**Not financial advice. Always DYOR and trade at your own risk.

Going Short on a Shooting star candleseries of lower highs and lower lows indicating a downtrend. SL is mentioned by the red line and TP will be at almost 10%

ALGOOAAALLLL ⚽️Hello TradingView Family / Fellow Traders. This is Richard, as known as theSignalyst.
As per my last idea (attached in the Related Ideas below), you know that I am keeping an eye on tokens that might get more exposure during the World Cup 2022.
Here is a quick reminder:
FIFA has teamed up with blockchain technology company Algorand to agree a sponsorship and technical partnership deal.
The agreement means Algorand will become the official blockchain platform of FIFA and provide the official blockchain-supported wallet solution. As per the sponsorship agreement, Algorand will be a FIFA World Cup Qatar 2022™ Regional Supporter in North America and Europe, and a FIFA Women’s World Cup Australia and New Zealand 2023™ Official Sponsor.
Source: Tweet attached on the chart
📉Technical Analysis:
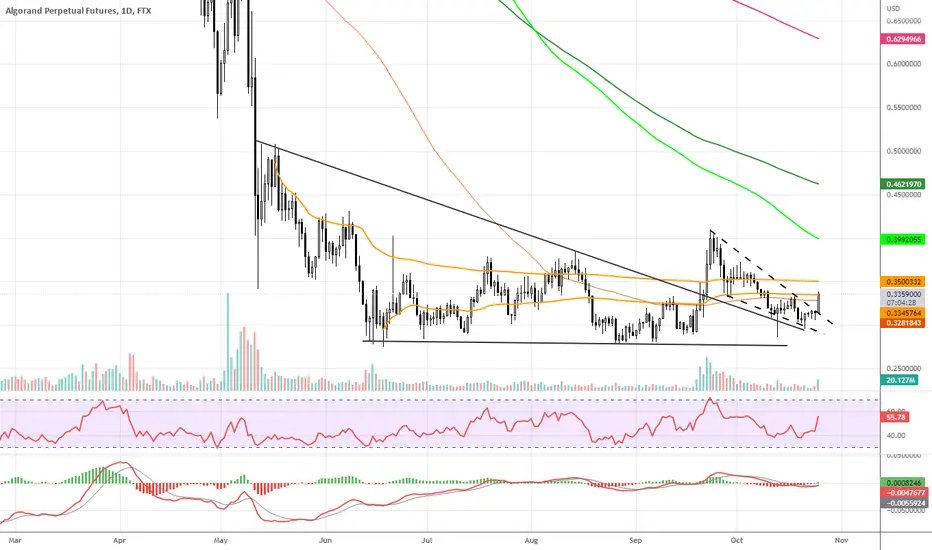
ALGO lately rejected a weekly support zone 0.20 - 0.30 and since then it has been stuck inside a big range.
For the bulls to take over from a long-term perspective, we need a momentum daily candle close above the upper bound of the range (gray zone) around 0.440
Meanwhile, if ALGO rejected the upper gray zone and trades lower, we will be looking for short-term buy setups as it approaches the lower gray zone again.
Always follow your trading plan regarding entry, risk management, and trade management.
Good luck!
All Strategies Are Good; If Managed Properly!
~Rich

Algorand appears to finally be triggering the inv h&s breakoutJust needs to flip the 1 day 200ma (in blue) to solidified support and it should reach both breakout targets not so long after. If it does I’m pretty confident it will see a golden cross in its near future. *not financial advice*

ALGOUSD Potential Golden Cross can send it to 0.800.Algorand (ALGOUSD) is having an impressive rise since November 02 where after a small pull-back, successfully tested the 1D MA50 (blue trend-line) as a Support. Yesterday it even broke above the 1D MA200 (orange trend-line) for the first time since January 13 and that is on its own a major bullish break-out.
However on this chart we want to focus on the emerging Golden Cross pattern on the 1D time-frame (when the 1D MA50 crosses above the 1D MA200). A potential new Golden Cross, can have the immediate "rally effect" of those that took place post 2020. As you see there have been three occurrences (July 15 2020, January 07 2021 and September 21 2021) all posting similar MACD patterns as today's. As you see the rallies that followed the Golden Crosses have been very aggressive. For better illustration and comparison purposes, we have put them all inside a table.
Those of July 2020 and Sep 2021 have been on similar magnitude while Jan 2021 has been a bit stronger. Assuming a similar rally takes place, ALGO could reach as high as 0.800, which is around the May 08 High (Resistance 2). Of course we need to consider 0.5100 and Resistance 1 as well.
-------------------------------------------------------------------------------
** Please LIKE 👍, SUBSCRIBE ✅, SHARE 🙌 and COMMENT ✍ if you enjoy this idea! Also share your ideas and charts in the comments section below! This is best way to keep it relevant, support me, keep the content here free and allow the idea to reach as many people as possible. **
-------------------------------------------------------------------------------
You may also TELL ME 🙋♀️🙋♂️ in the comments section which symbol you want me to analyze next and on which time-frame. The one with the most posts will be published tomorrow! 👏🎁
-------------------------------------------------------------------------------
👇 👇 👇 👇 👇 👇
💸💸💸💸💸💸
👇 👇 👇 👇 👇 👇

#ALGO Algorand breaking out this falling wedgeAlgorand has consolidated over the last week in the form of a falling wedge, which has broken out to the upside today. We are starting to see a slight uptick in volume today on the break which is encouraging. This should trade back to the previous highs seen in September of approximately 0.41. stop close below 0.30
[UPDATE ALGO] A lot of alts are going to do this in November?Algorand move:
1) as soon as we cross 0.38 --> 0.43 is fast in my opinions
2) my gut tells me 0.43 is going to be easy, so the next natural target is 0.50 which is the mid-range (macro)
3) we can have a deviation on the upside up to 0.70 if BTC behaves in November
This is true for Algo and for many other alts.

ALGO - No clear buying opportunity
Even though Algorand has lost almost 90% of it´s value from the Nov21 high, I still see room for a 60+% drop.
Price has been walking sideways since June, and there is no clear sign of bulls showing up.
Also note that the 100% ABC extension sits at 0.1135. Of that price level doesn't HAVE to be touched, but it is very common that ABC´s reach the 100%.
For the time being, I´m only looking for short scalp trades on ALGO.

ALGO - Wait For The Bulls!Hello TradingView Family / Fellow Traders. This is Richard, as known as theSignalyst.
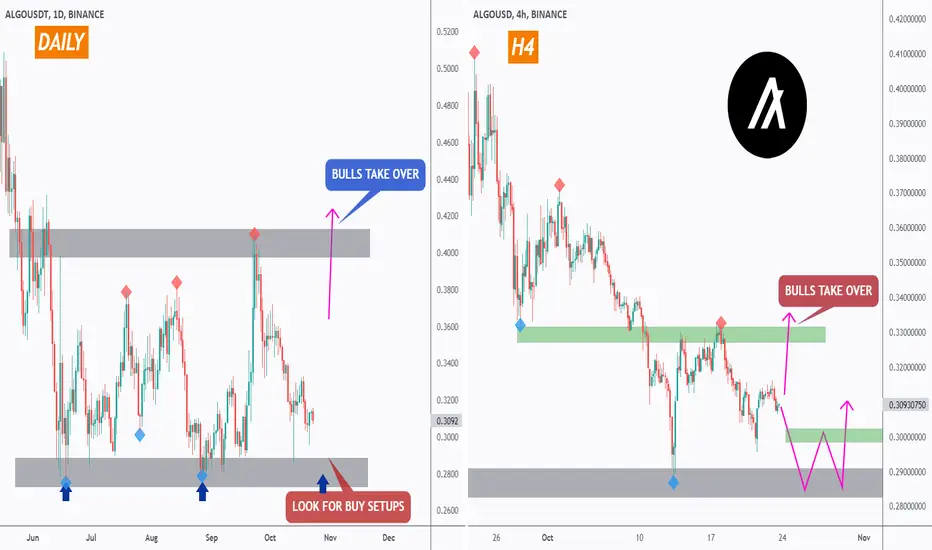
DAILY: Left Chart
ALGO has been stuck inside a range for a while.
For the bulls to take over from a long-term perspective, we need a break above the upper gray area (upper bound of the range)
Meanwhile, as we are approaching the lower bound of the range, we will be looking for buy setups on lower timeframes.
H4: Right Chart
From a medium-term perspective, we have been bearish making lower lows and lower highs.
For the bulls to take over, we need a momentum candle close above the last major high marked in green.
Meanwhile, until the buy is activated, ALGO can still trade lower till the gray zone where we will be looking for new buy setups.
Always follow your trading plan regarding entry, risk management, and trade management.
Good luck!
All Strategies Are Good; If Managed Properly!
~Rich

12H Support to go along with Weekly HoldNothing fancy here. 12H 200MA has been respected to the tee since last December. Coming for the retest as support today. Held weekly 10sma at close, held 2 week 10sma at close. Already broke out of long descending channel. FIFA World Cup on the horizton. This sucker looks ripe.

$ALGO | Potential Move Up To Previous ResistanceALGOUSD was at mid-September levels of being oversold and broke the lower Bollinger Band. I waited on confirmation for this potential reversal to the upside because of this. We had a green candle closing fully above the bottom band and above the most resistant near term support levels. Got in a buy highlighted by LONG POSITION graph with the mindset of taking profit slightly above the 200 EMA which hasn't been respected most recently but BELOW the nearest resistance which has. Will need a decent sized green candle to push through. Stop loss placed below BOTH the lower band and support levels.

Algo LongAlgo took out the local high for a HH over two weeks ago and has since been consolidating above support. Easy trade setup here. Possible double bottom on support at the 10sma. Close under weekly 10, exit on retest.
